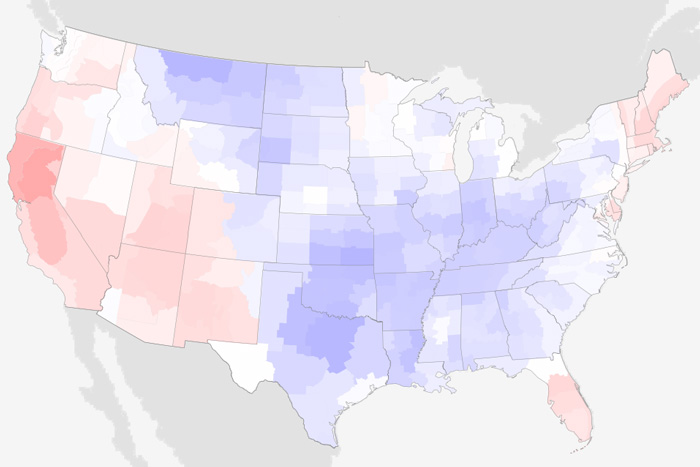
May 2021 was mild across much of the contiguous U.S., with dry conditions widespread across the West, the Northern Plains, the Ohio Valley, and the Mid-Atlantic.
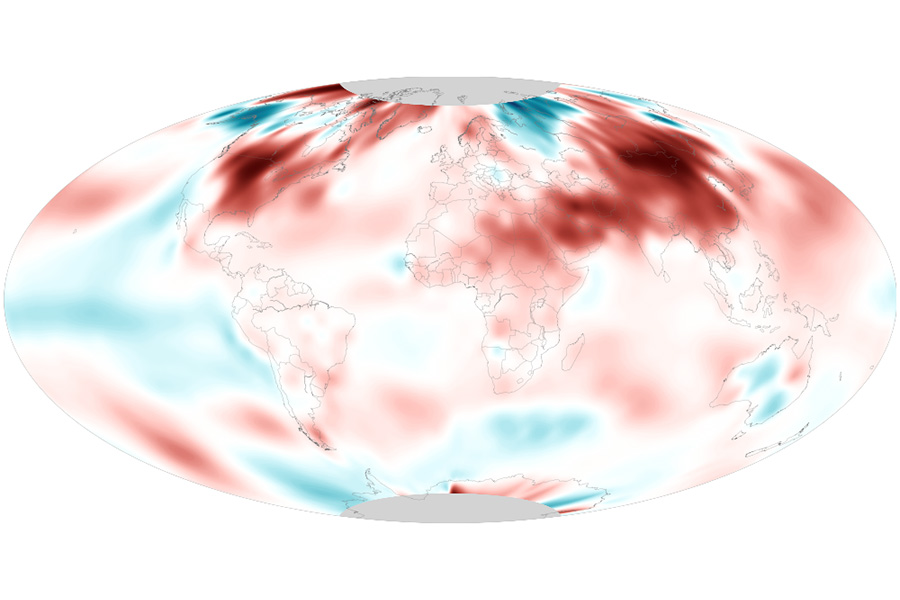
Although this was the smallest warm departure for any March since 2014, it was still the eighth-warmest March for the planet in the 142-year record.
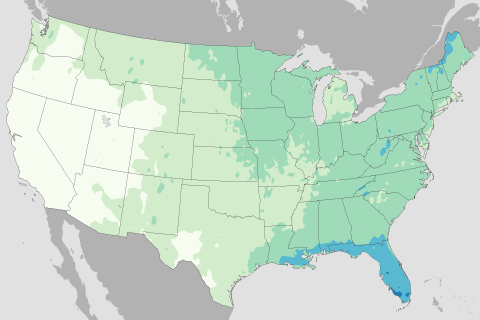
Every ten years, NOAA releases an analysis of U.S. weather of the past three decades, calculating average values for temperature, rainfall, and other climate conditions that have come to represent the new “normals” of our changing climate.
We live in a warming world. And we often characterize that warming through metrics of temperature. But that’s only a sliver of the story. Another sliver, and perhaps a more consequential one, is Big Rain.
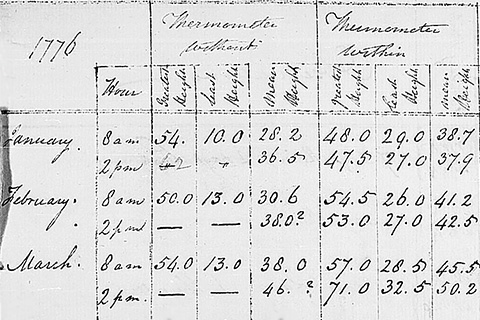
The U.S. climate record begins 125 years ago. Where do the data come from, and who had the foresight to begin collecting and preserving observations so many years ago?
How much do ENSO blog writers like marine-based observations? Enough for one of them to write a love letter to a buoy.
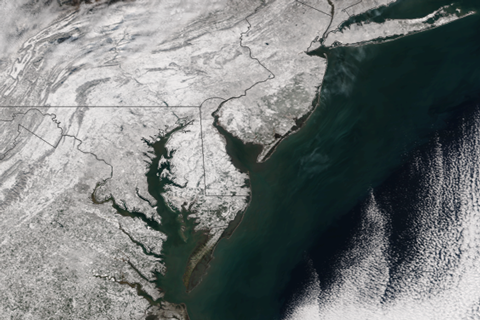
In mid-March, a cold air outbreak brought freezing temperatures to the Southeast devastating crops and causing over $1 billion in agricultural losses. For those of us who love fruit this is bad news. In this Beyond the Data post, we explain why it was so devastating even though freezing temperatures in mid-March aren’t that unusual for the Southeast.
What are NOAA's predictions for this possible La Niña winter of 2016-17, and how did its predictions for last winter fare during the strong El Niño? Guest blogger Mike Halpert gives us the lowdown.
It might seem strange to be talking about snow cover during the heat of summer, but July 1st was “Snow New Year.” As most people do at the start of a new year, we’re reflecting on events from the past year to understand where we have been and where we might be going.
In this Beyond the Data blog, Deke Arndt talks about using the climate record to predict the odds of rain on the Fourth of July.