
Image caption
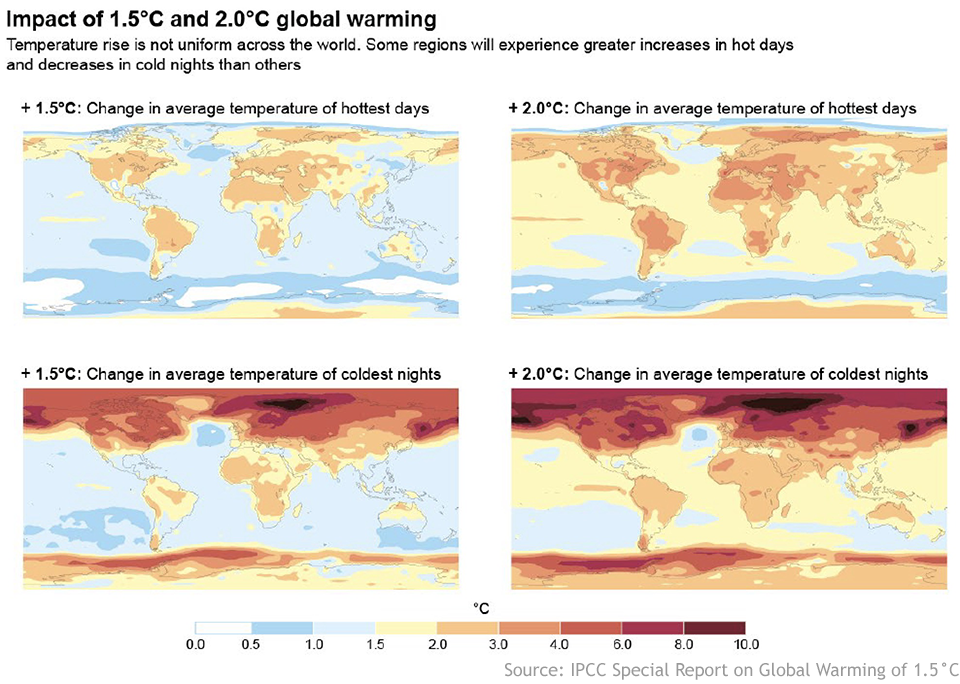
Temperature change is not uniform across the globe. Projected changes are shown for the average temperature of the annual hottest day (top) and the annual coldest night (bottom) with 1.5°C of global warming (left) and 2°C of global warming (right) compared to pre-industrial levels. Graphic appears in FAQ 3.1 in the Frequently Asked Questions supplement to the IPCC Special Report on Global Warming of 1.5°C.