
Image caption
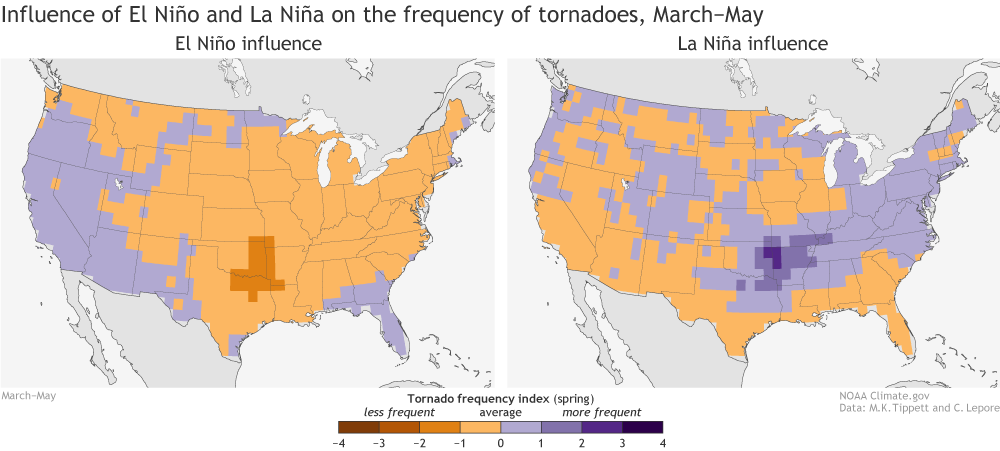
March-May values of a blend of tornado reports with a tornado environment index (TEI) for El Nino and La Nina years. Maps by climate.gov; data from C. Lepore and M. Tippett.
March-May values of a blend of tornado reports with a tornado environment index (TEI) for El Nino and La Nina years. Maps by climate.gov; data from C. Lepore and M. Tippett.