
Image caption
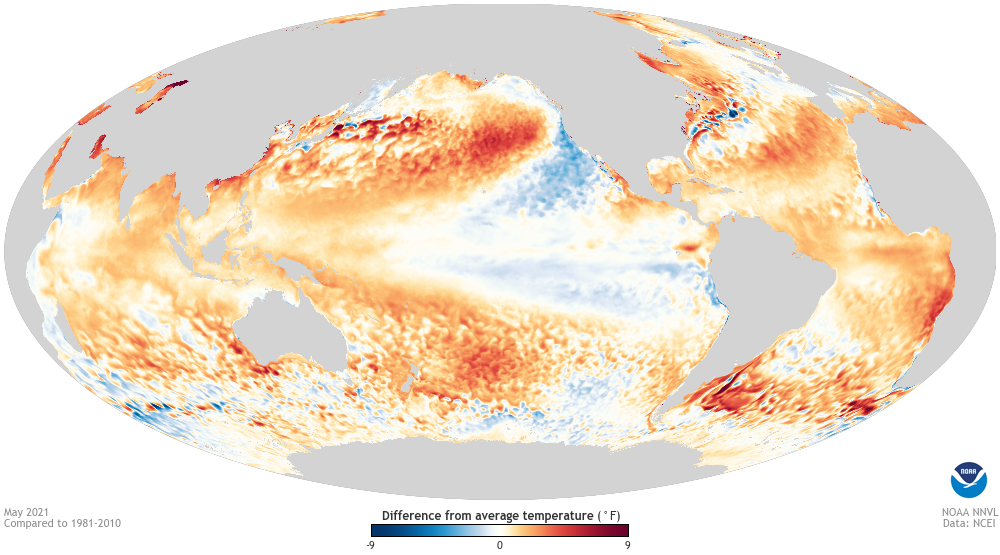
May 2021 sea surface temperature departure from the 1981-2010 average (note that this image still uses the previous averaging period). Image from Data Snapshots on Climate.gov.
May 2021 sea surface temperature departure from the 1981-2010 average (note that this image still uses the previous averaging period). Image from Data Snapshots on Climate.gov.