
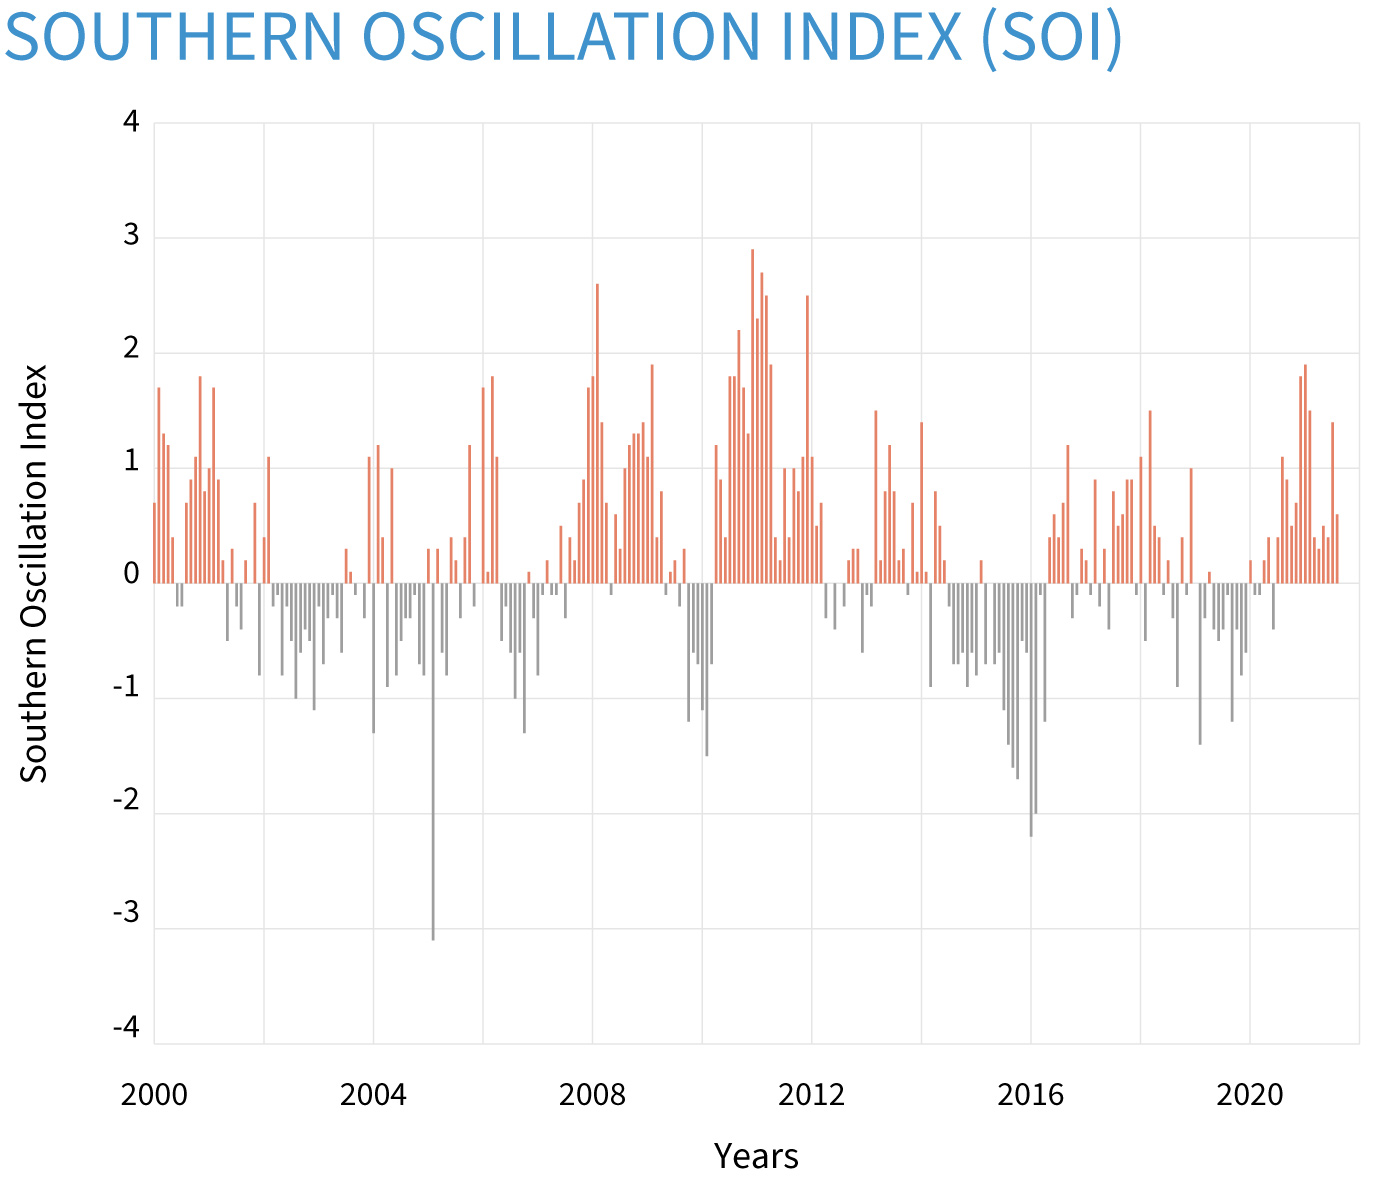
Image caption
Monthly surface pressure anomalies—differences from the 1981-2010 average—in Darwin, Australia, compared to Tahiti. Positive values indicate a strong Walker Circulation, which occurs during La Niña. Negative values indicate a weak or disrupted Walker Circulation, which occurs during El Niño. NOAA Climate.gov image, based on data from the Climate Prediction Center.