
Image caption
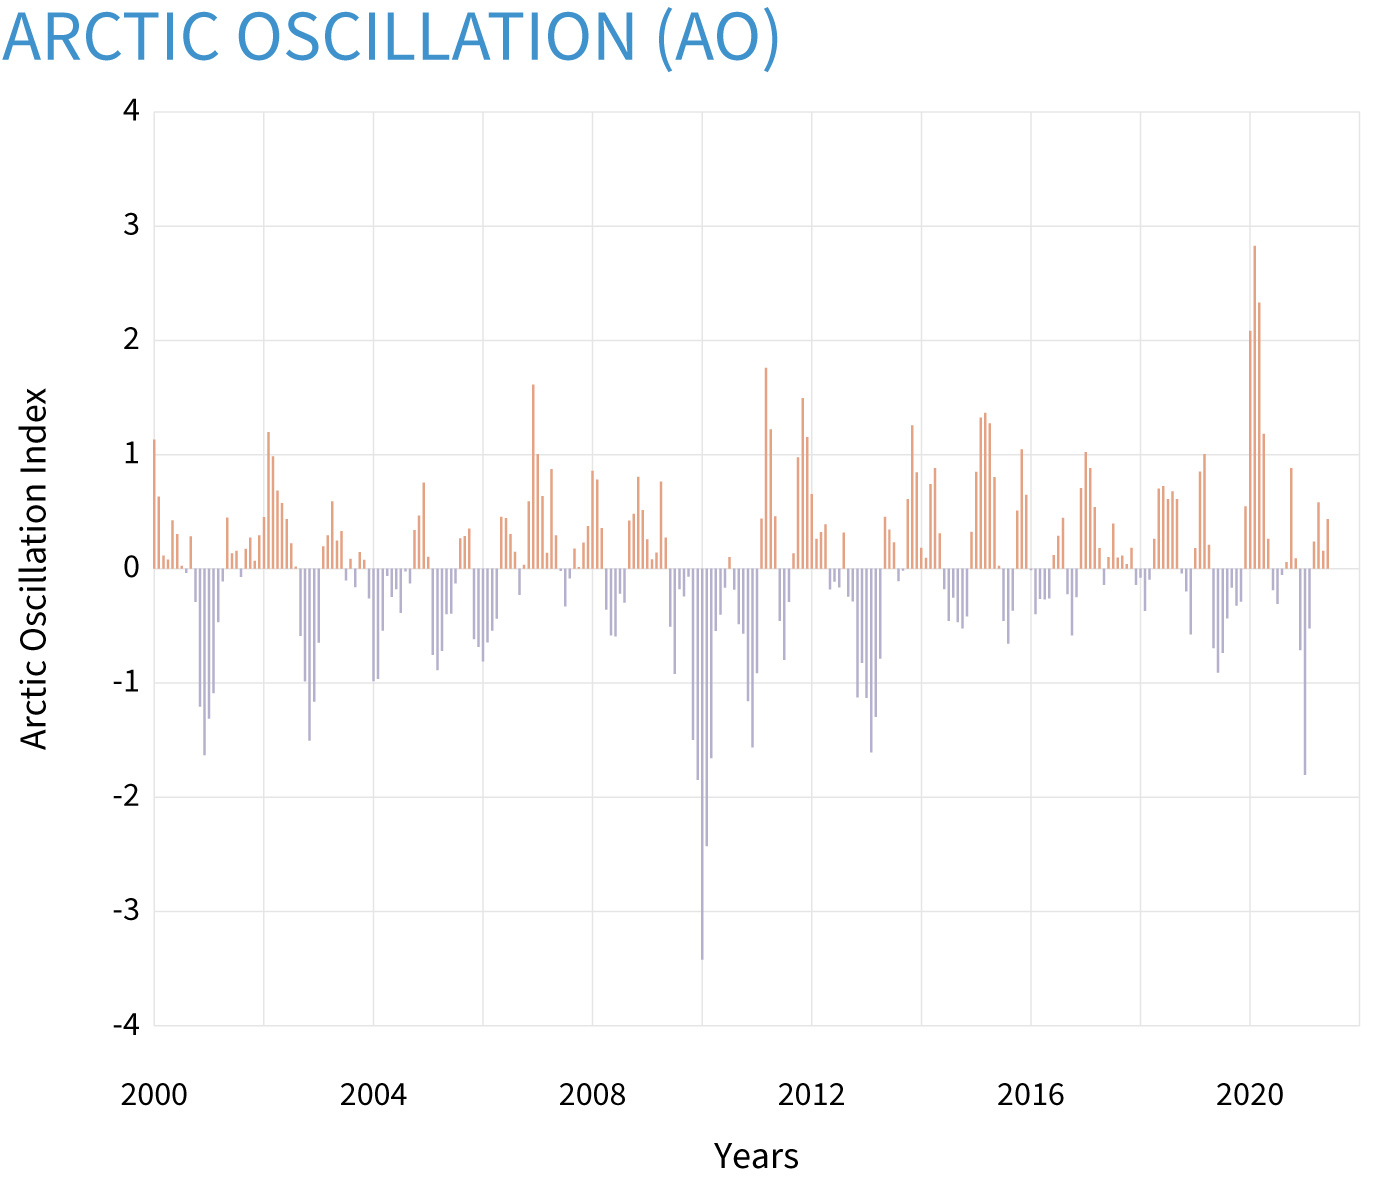
Seasonal (3-month) values for the Arctic Oscillation Index, which tracks shifts in surface pressure between the mid-latitudes and the Arctic. During the positive phase, the jet stream stays farther north, and mid-latitude winters are milder than usual. During the negative phase, the jet stream dips into the mid-latitudes, creating cold-air outbreaks. NOAA Climate.gov image, based on data from the Physical Sciences Lab.