
Image caption
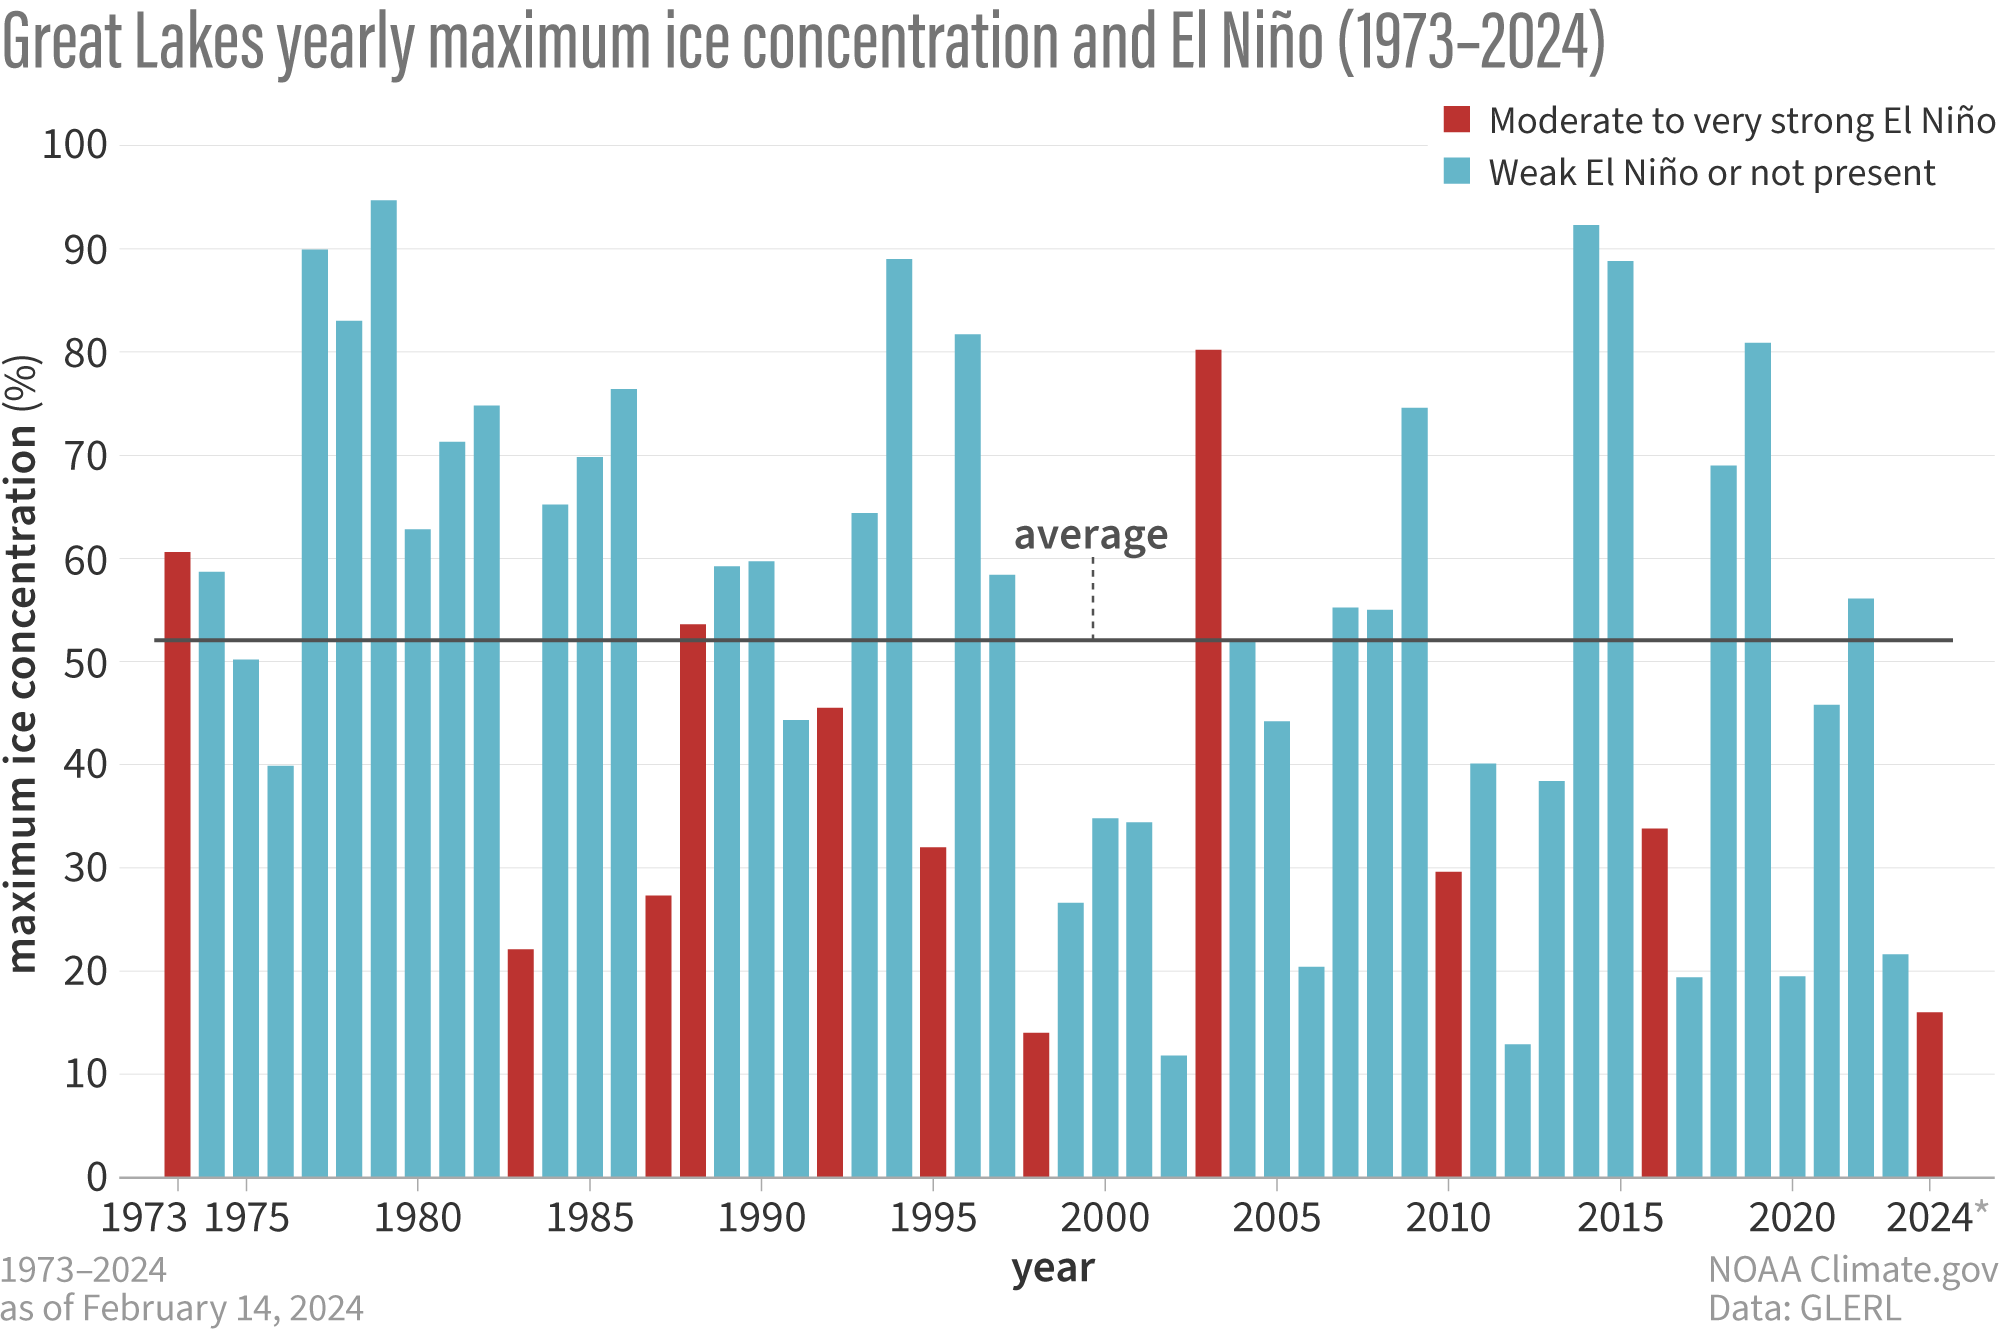
Yearly maximum ice concentration in the Great Lakes showing the influence of El Niño on ice cover. Most moderate or stronger El Niño years (red bars) were below the 1973-2024 average (black line). Other years, including La Niña, neutral, and weak El Niño, are blue. Data for 2024 are preliminary. Image by climate.gov from NOAA's Great Lakes Environmental Research Laboratory data.