
Image caption
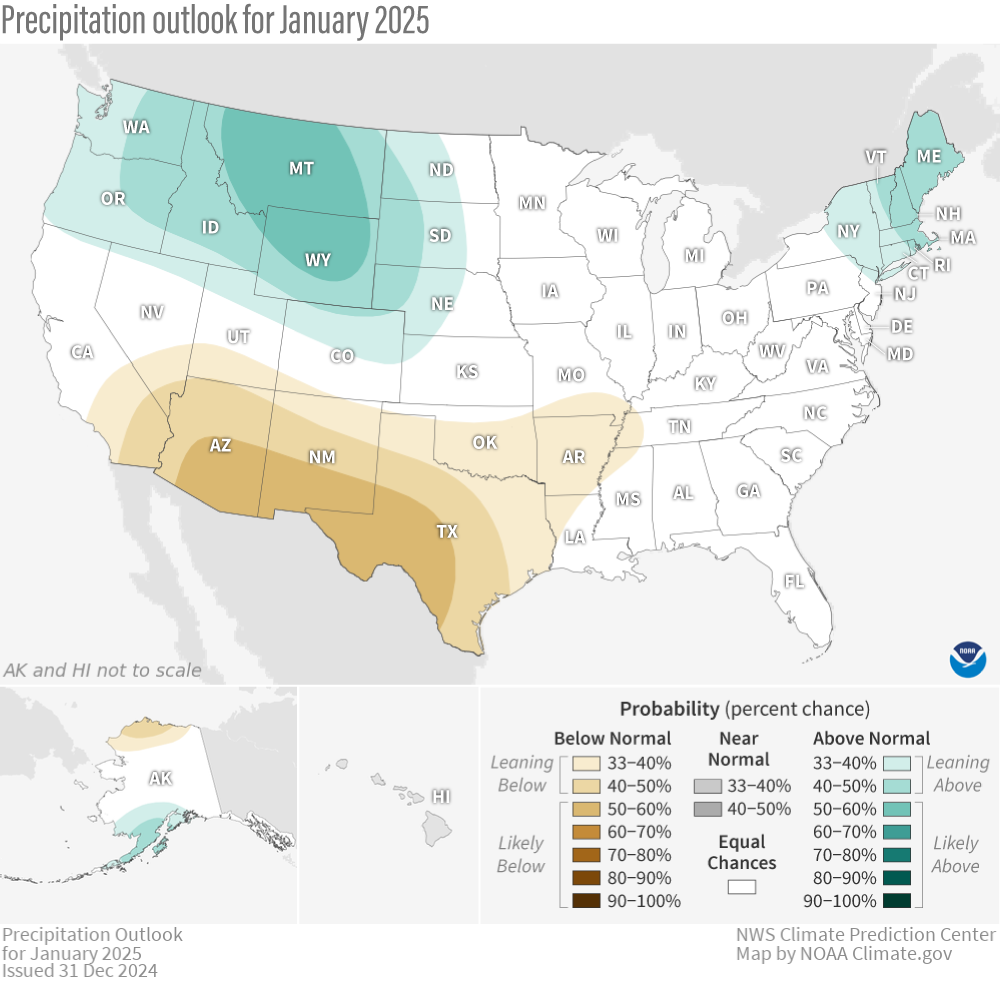
The precipitation outlook for January 2025 factors in the influence of a developing La Niña event in the tropical Pacific. Precipitation is favored to be much wetter than average (green colors) in the Pacific Northwest and nearby inland areas, but much drier than average (browns) in the Southwest from Southern California to Texas. Darker colors mean higher chances, not more extreme precipitation departures. White areas mean that there are equal chances for a wet, dry, or near-average January. Much higher or much lower than average means "in the upper or lower third" of total January precipitation (rain and snow) amounts from 1991-2020. Text-only forecast for Hawaii available from NOAA Climate Prediction Center. NOAA Climate.gov image from our Data Snapshots collection, based on data from the Climate Prediction Center.