Beyond the Data: NOAA's new climate monitoring blog
Hi, and welcome to Beyond the Data: A blog by the nation’s official climate record keepers. As our fancy tagline suggests, the authors of this blog are charged—with our wonderful colleagues—to keep the records of the nation’s and the world’s climate system.
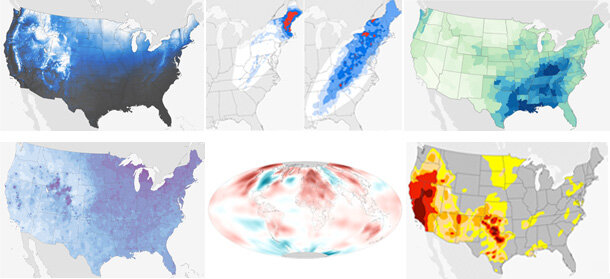
Just a few of the suite of records kept by the NCEI Monitoring Branch. (Top, left to right). Probability of a white Christmas, snowstorm rankings, monthly precipitation. (Bottom). Coldest day of the year, difference form average monthly temperature, weekly drought conditions. Maps by Climate.gov, based on data provided by NCEI.
In the way of introductions, here’s a little more about each of us:

Dr. Jessica Blunden authors NOAA’s monthly global climate reports. A North Carolina native, she’s a graduate of Appalachian State University and earned her doctorate at North Carolina State University, where she focused on atmospheric chemistry and air quality. She’s served five consecutive years as the lead editor of the Bulletin of the American Meteorological Society’s State of the Climate report, which is a full “annual physical” of the global climate system, written by no less than 420 scientists from every inhabited continent on the planet. In a 2011 interview with Climate.gov, she explained why it takes up to half a year to recap the previous year’s climate.
Jake Crouch is a graduate of The University of North Carolina at Asheville and NC State University. He hails from West Virginia, and authors NOAA’s monthly climate reports for the United States, and parts of the global report, too. His research background involves understanding precipitation patterns in the Pacific Northwest. At NCEI, Jake works to integrate satellite information into our more traditional weather-station-based products. He also does lots and lots of interviews on behalf of NCEI Monitoring. For example, in the video at right, he’s at an American Meteorological Society meeting, being interviewed about climate conditions in 2011.
The entire Northern Hemisphere was warm during 2012. Drought affected agricultural regions in North America, Europe, eastern Russia, the Ukraine, and Kazakhstan. These warm conditions impacted grain yields, water supplies, and heat-related illness. Global food prices rose by 10 percent during July. Learning how our neighbors around the world cope with and adapt to extreme events can help us make better decisions, become more resilient, and be "climate smart."
Deke Arndt grew up both personally and professionally in Oklahoma, and earned his meteorology degrees at the University of Oklahoma. His research background is in “land-atmosphere interaction,” a fancy way of describing how changing the land surface (by moistening, drying, roughing, or smoothing) affects outcomes in the atmosphere just above. He has edited the State of the Climate series for six years now, the last five in the co-pilot’s chair supporting Dr. Blunden. He’s also spent some time in front of the camera for Climate.gov’s video productions. Here he is highlighting the major extreme events that occurred in 2012.
We work for you, at NOAA’s National Centers for Environmental Information (NCEI). If you’ve ever wondered what happens to the numbers you see on your nightly weathercast—the daily high and low temperature, how much rain or snow fell—they end up at NCEI, along with almost all of NOAA’s earth-systems information ever collected, from the bottom of the ocean to the surface of the Sun, collected by satellites, weather stations, buoys, ships, subs, and 19th century farmers. NCEI keeps these data safe and available for today’s generations and for future generations.
We work with the “climate” chunks of NOAA’s data collections. Specifically, we do climate monitoring, which more or less boils down into keeping score, providing a play-by-play, and a little color commentary on what is happening across this climate system we all share.
The record-keeper/scorekeeper metaphor isn’t perfect, but it’s not bad. In any game, you need to know what is happening, what has happened, how things are changing, and how do today’s results fit with the big picture. That’s our role. We lean on thousands of our fellow scientists and tens of thousands of weather observers, from those who observed Earth’s climate long ago to those who collect data today and every day.
And let’s face it: the “game” we’re tracking isn’t a small game. Climate is big. Climate variability is big. Climate change is huge. Climate variability and change can drive multi-billion dollar swings in our economy, uproot ecosystems and people, and change whole histories. And it’s not going away.
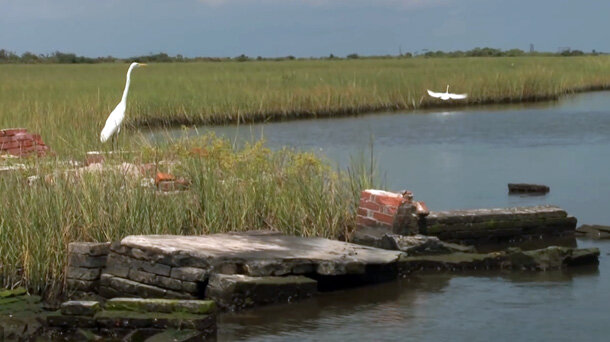
The ruins of Leeville, Louisiana, a Gulf Coast community overtaken by tidal marsh and the sea during the past century. Screen capture from Climate.gov video, Leaving Leeville.
Climate change as an actual issue will long outlast climate change as a debate topic. Your grandchildren will be dealing with it, probably using some of the same data we analyze in real time.
Every other week over the next year, this blog will cover the basics of everyday climate monitoring. We’ll touch on questions like:
- What parts of the country and the calendar are warming the most?
- How does the latest drought, or wet episode, or heat wave, or cold winter, stack up against similar events from history?
- How is drought in the Western US different than drought in the Plains?
- Does climate affect extreme weather events? How? How can something that plods on over decades affect something that develops in minutes to hours?
- If you had a wet spring, what are your chances for a cool summer? Does season matter in this relationship? Does your location matter? (Of course they do!!!)
- If we threw away the surface temperature record, we’d still know, confidently, that the world is warming. How so?
We’ll also dig a little deeper into how we arrive at what we know. Scorekeepers can’t just observe and record the game, they must know the rules. In a similar way, those of us entrusted to monitor the climate system must know the rules of handling data, making calculations, how to blend different data sources, and so on. That’s where we’ll go beyond the data. We’ll address topics like:
- What is a “normal” temperature, anyway?
- What are the ground rules – and in this case, literally ground rules – for measuring drought in one part of the country versus another?
- How do German WWI military tactics introduced under Kaiser Wilhelm play a significant role in assessing the global temperature record today?
- Reporting the number of broken records across the US can get pretty repetitive – like, well, a broken record. What are some of the pitfalls of “counting records”? And why do we do it anyway?
- When can datasets change? How does that happen? Heck, why would data change?
When we can, we’ll drop a line or two about what does all of this mean? And not just what it means in terms of our present and future. But what does it mean to be a record-keeper for an important game?
- What kind of businesses use climate information and why?
- How do El Nino and La Nina, so expertly defined over in The ENSO Blog, affect not just seasonal outcomes from region to region, but longer-term outcomes for the entire globe?
- What do you learn about climate, and about yourself, when you work with authors from around the world to take the annual physical of our shared climate system?
We’ll be blogging every other week, more or less. We’ve had to make a tough decision to turn off comments, at least for the time being. It’s not because we don’t want to hear from you, or because we can’t handle criticism—if that’s what you want to share. We’re a small team with large responsibilities, and moderating comments from dozens (maybe hundreds!) of readers can turn into a full time job. If you have feedback or questions about the blog posts, you can always contact the Climate.gov editorial team through email, Facebook, or Twitter.
We are looking forward to this experience. We’re also looking forward to watching our nation do great things with climate data in a post-controversy world, and we hope Beyond the Data helps prepare that path in some small way.