How much do climate patterns influence predictability across the United States?
In our post last month, we introduced and defined several climate patterns other than ENSO that impact United States winter climate. But how useful are these climate patterns in predicting U.S. temperature and precipitation in winter and other seasons? How do they stack up against ENSO, for example?
Long-term Trends
For all seasons combined, upward temperature trends have been observed across much of the U.S., especially in the northern and western regions (Fig. 1). The southeastern U.S. has had a slower warming trend (Livezey and Timofeyeva 2008).
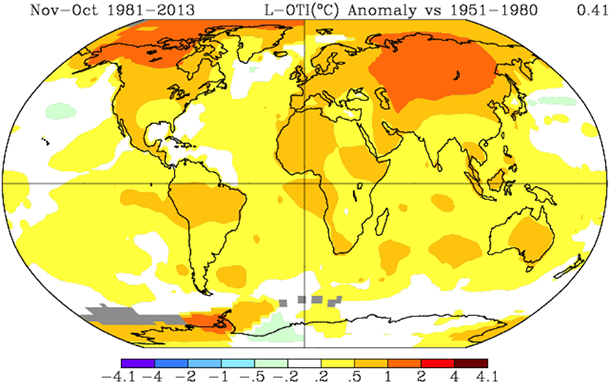
Figure 1. Difference between the annual average temperature during 1981-2013, and that over the previous period of 1951-1980 (˚C). Image credit: NASA/GISS.
Unlike the other climate patterns, this pattern of rising temperature is present in all seasons, not just winter, so it provides a more unconditional source of climate predictability. Compared with temperature, precipitation trends have been weaker and more variable both geographically and seasonally, and contribute little to predictability.
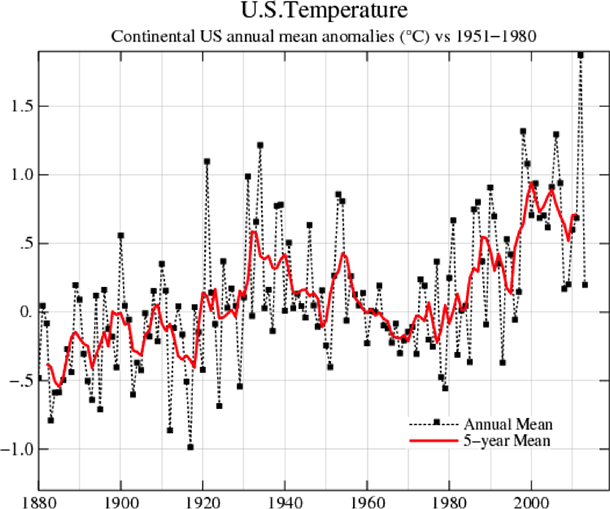
Figure 2. Annual average temperature over the continental U.S. with respect to the 1951-1980 period (black line), and the average of the 5 years centered on the given year (red line). Image credit: NASA/GISS.
In the U.S. the average warming was most pronounced during the 1980s and 1990s, and has plateaued since around the turn of the century (Fig. 2). This plateau has been most pronounced during winter, slight cooling has even been observed in some regions (Cohen et al. 2012). During the periods of most rapid warming, forecasts for above normal temperature were often skillful no matter what the ENSO situation was, although ENSO continued to show its familiar winter pattern superimposed over warming conditions. Climate forecasters monitor trends over the recent 10 to 15 years at each location and each season (1), factoring them into their forecasts along with statistical and dynamical climate prediction models.
The North Atlantic Oscillation (NAO)/ Arctic Oscillation (AO)
The NAO is a seesaw in atmospheric pressure, both at the surface and in the upper atmosphere, between the far north Atlantic (near Greenland and Iceland) and the lower mid-latitudes of the Atlantic, eastern U.S. and Europe. The AO is a hemisphere-wide version of the NAO, with seesaw points in the polar region versus the mid-latitudes extending across much of the globe. A problem with the NAO/AO is that while its winter climate effects are strong and well known over the eastern U.S. (see Fig. 3), until recently the pattern itself has generally been considered to be poorly predicted and commonly considered a “wild card” by climate forecasters—in sharp contrast to ENSO. Recently, there has been research suggesting there may be some predictability for the wintertime NAO/AO (Riddle et al. 2013; Kang et al. 2014; Scaife et al. 2014), though the possible factors leading to this skill are hotly debated. Such possible factors are the extent of Siberian snow cover in the preceding autumn, Arctic sea ice, and Atlantic or Pacific sea surface temperatures. It is also possible that the apparent wintertime seasonal skill of the NAO/AO is arising by chance and there are no significant skill sources (e.g. DelSole and Shukla 2009).
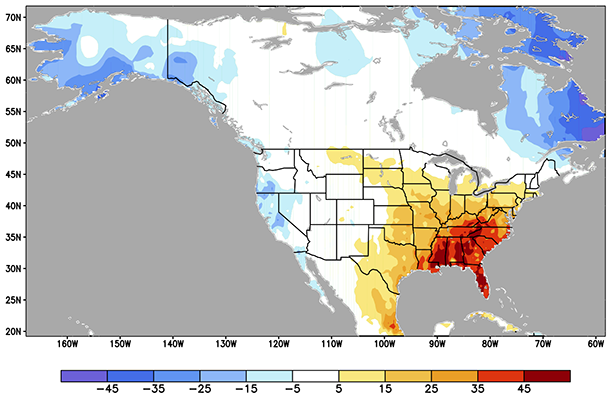
Figure 3. Temperature effect of the positive phase of the AO during the 3-month period of December-February. Colors indicate the squared correlation, multiplied by 100, between the AO index and surface air temperature, with negative sign preserved when squaring. -1.0 and 1.0 are the minimum and maximum possible squared correlations, respectively. The AO index is that of NOAA/CPC, and the temperature data is the GHCN+CAMS data (Fan and van den Dool 2008). Image credit: M. L’Heureux of NOAA/CPC.
Pacific Decadal Oscillation (PDO)
The effects of the PDO on U.S. climate occur mainly during winter and spring, when the positive phase is associated with above average rainfall in the southwestern U.S., and negative phase with below average rains there (Dai 2013). Consistent with this, a recent study (Lyon et al. 2013) has implicated a PDO-like pattern in the recent persistent drought in the Southwest U.S., at least during spring. The PDO was in positive phase during 1924-1945, negative phase during 1946-1976, positive 1977-1998, and negative since 1999 (see Fig. 4). The PDO pattern overlaps with the ENSO pattern in the tropical Pacific (i.e., a positive phase PDO meshes with El Niño, negative phase with La Niña). So, while the PDO has been in negative phase in the recent decade, there has been a slight tendency toward more La Niña than El Niño events (2). A debate continues about the nature of the relationship between ENSO and the PDO, including evidence that the PDO is mostly a consequence of ENSO (Newman et al., 2003). A recent study suggests that the climate impacts of the PDO are hard to use as a prediction for 3-month, seasonal periods, because other sources of variability, mainly faster-acting ones, easily overshadow the PDO’s effect (Kumar et al 2013). This means that the PDO impact is more noticeable over longer periods (i.e., decadal, and not seasonal), or when averaged over adjacent years having the same PDO phase.
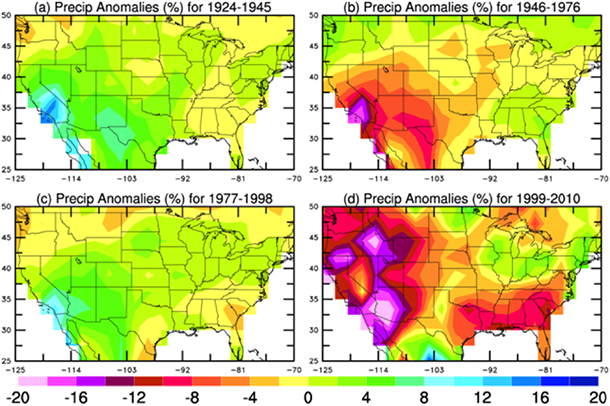
Figure 4. Departure from the 1924-1998 average for each of four PDO periods: (a) 1924-1945, (b) 1946-1976, (c) 1977-1998, and (d) 1999-2010. Data were detrended using a linear trend analysis before computing the departures for the four periods. Note that 1999-2010 departures may be affected by individual ENSO events and other shorter-term variations due to the shortness of the period compared with the other periods. Image credit: A. Dai (Climate Dynamics, 2013).
The Bottom Line
While trends, the NAO/AO, and the PDO are important, ENSO is the 800-pound gorilla in the room because it can be predicted several months in advance and the physical basis for this prediction is understood. Because El Niño and La Niña events often develop during late spring or summer and last through the forthcoming winter, the effects of ENSO on U.S. winter climate can often be predicted, making for a fairly reliable source of mainly winter predictive skill in the U.S. (Ropelewski and Halpert 1986; Barnston 1994; Livezey and Timofeyeva 2008). Of course, not all El Niño and La Niña events produce the average expected effects, so the forecasts still have uncertainty.
The next most important predictable influence, mainly for temperature, is trends; these apply to all seasons. Next, the NAO/AO produces a huge influence on temperature and precipitation in the eastern half of the U.S., mainly during winter. But the NAO/AO is unable to be predicted with very much confidence. Finally, the PDO may have its own impacts on decadal timescales, mainly in winter and spring in the southwestern U.S., but it can be difficult to distinguish its seasonal impacts in the midst of other sources of variability, and also difficult to distinguish its impacts from those of ENSO. Today’s climate models are most adept at predicting the year-to-year climate fluctuations associated with ENSO, next best at predicting trends related to climate change, and least effective in reproducing the observed changes in the NAO/AO and the decadal-scale PDO. Clearly, we have a long way to go in improving climate prediction models for seasonal timescales.
Footnotes
(1) One such tool that seasonal climate forecasters depend on are the Optimum Climate Normals (OCN) (Huang et al. 1996), which indicate 10 or 15 year trends for temperature and precipitation, respectively.
(2) Based on the Oceanic Niño Index (3-month averages in the Niño-3.4 region) historical episodes of El Niño and La Niña can be identified. In the last ten years, for example, we have seen 5 La Niña episodes and 3 El Niño episodes.
References
Barnston, A. G., 1994: Linear statistical short-term predictive skill in the Northern Hemisphere. J. Climate, 7, 1513-1564.
Cohen, J. L., J. C. Furtado, M. Barlow, V. A. Alexeev, and J. E Cherry, 2012: Asymmetric seasonal temperature trends. Geophys. Res. Lett., 39, 4, DOI: 10.1029/2011GL050582.
Dai, A., 2013: The influence of the inter-decadal Pacific oscillation on U.S. precipitation during 1923-2010. Clim. Dyn., 41, 633-646.
DelSole, T., and J. Shukla, 2009: Artificial skill due to predictor screening. J. Climate, 22, 331-345.
Fan, Y. and H. van den Dool, 2008: A global monthly land surface air temperature analysis for 1948–present. J. Geopohys. Res., 113, doi:10.1029/2007JD008470.
Huang, J., H. M. Van den Dool, and A. G. Barnston, 1996: Long-lead seasonal temperature prediction using optimal climate normal. J. Climate, 9, 809-817.
Kang, D, M.-I. Lee, J. Im, D. Kim, H.-M. Kim, H.-S. Kang, S. D. Schubert, A. Arribas, and C. MacLachlan, 2014, Prediction of the Arctic Oscillation in boreal winter by dynamical seasonal forecasting systems. Geophys. Res. Lett., 41, 3577-3585. doi:10.1002/2014GL060011.
Kumar, A., H. Wang, W. Wang, Y. Xue, and Z.-Z. Hu, 2013: Does knowing the oceanic PDO phase help predict the atmospheric anomalies in subsequent months? J. Climate, 26, 1268-1285.
Livezey, R. E., and M. M. Timofeyeva, 2008: The first decade of long-lead U.S. seasonal forecasts: Insights from a skill analysis. Bull.. Amer. Meteor. Soc., 89, 843-854.
Lyon, B., A.G. Barnston, and D.G. DeWitt, 2013: Tropical Pacific forcing of a 1998-99 climate shift: Observational analysis and climate model results for the boreal spring season. Climate Dyn., dpi 10.1007/s00382-013-1891-9.
Newman, Matthew, Gilbert P. Compo, Michael A. Alexander, 2003: ENSO-Forced Variability of the Pacific Decadal Oscillation. J. Climate, 16, 3853–3857.
Riddle, E. E., A. H. Butler, J. C. Furtado, J. L. Cohen, and A. Kumar, 2013: CFSv2 ensemble prediction of the wintertime Arctic Oscillation Clim. Dyn., 41, 1099-1116.
Ropelewski and Halpert, 1986: North American precipitation and temperature patterns associated with the El Niño Southern Oscillation (ENSO). Mon. Wea. Rev., 114, 2352-2362.
Scaife, A. A., and Coauthors, 2014: Skillful long range prediction of European and North America winters. Geophy. Res. Lett., 41, 2514-2519. DOI: 10.1002/2014GL059637.
Comments
Add new comment