What’s the hottest Earth’s ever been?
This article was first published in August 2014, and it has been updated to include new research published since then. This article is one of a three-part series on past temperatures. One is about how warm the Earth has been “lately.” The other is about the coldest Earth's ever been.
Our 4.54-billion-year-old planet probably experienced its hottest temperatures in its earliest days, when it was still colliding with other rocky debris (planetesimals) careening around the solar system. The heat of these collisions would have kept Earth molten, with top-of-the-atmosphere temperatures upward of 3,600° Fahrenheit.
Even after those first scorching millennia, however, the planet has often been much warmer than it is now. (No, that doesn’t mean current warming is natural or that it won’t, overall, be harmful to humans and other life. We discuss that further later in the article.) One of the warmest times was during the geologic period known as the Neoproterozoic, between 600 and 800 million years ago. Conditions were also sometimes sweltering between 500 million and 250 million years ago. And within the last 100 million years, two major heat spikes occurred: the Cretaceous Hot Greenhouse (about 92 million years ago), and the Paleocene-Eocene Thermal Maximum (about 56 million years ago).
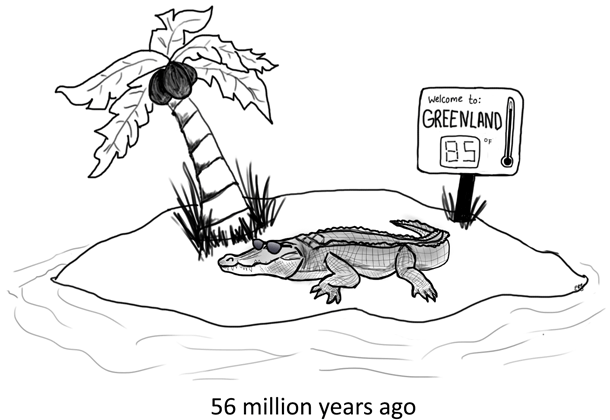
Cartoon by Emily Greenhalgh, NOAA Climate.gov.
History of hot
Temperature records from thermometers and weather stations exist only for a tiny portion of our planet's 4.54-billion-year-long life. By studying indirect clues—the chemical and structural signatures of rocks, fossils, and crystals, ocean sediments, fossilized reefs, tree rings, and ice cores—however, scientists can infer past temperatures.
None of these techniques help with the very early Earth. During the time known as the Hadean (yes, because it was like Hades), Earth’s collisions with other large planetesimals in our young solar system—including a Mars-sized one whose impact with Earth likely created the Moon—would have melted and vaporized most rock at the surface. Because no rocks on Earth have survived from so long ago, scientists have estimated early Earth conditions based on observations of the Moon and on astronomical models. Following the collision that spawned the Moon, the planet was estimated to have been around 2,300 Kelvin (3,680°F).
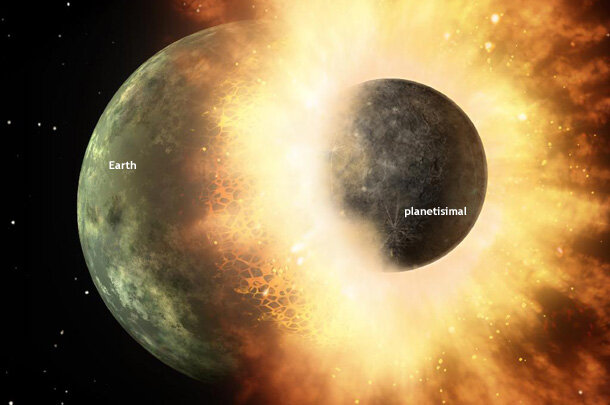
What the collision that spawned Earth's Moon may have looked like. Collisions between Earth and rocky debris in the early solar system would have kept the surface molten and surface temperatures blistering. Image courtesy NASA.
Even after collisions stopped, and the planet had tens of millions of years to cool, surface temperatures were likely more than 400° Fahrenheit. Zircon crystals from Australia, only about 150 million years younger than the Earth itself, hint that our planet may have cooled faster than scientists previously thought. Still, in its infancy, Earth would have experienced temperatures far higher than we humans could possibly survive.
But suppose we exclude the violent and scorching years when Earth first formed. When else has Earth’s surface sweltered?
Thawing the freezer
Between 600 and 800 million years ago—a period of time geologists call the Neoproterozoic—evidence suggests the Earth underwent an ice age so cold that ice sheets not only capped the polar latitudes, but may have extended all the way to sea level near the equator. Reflecting ever more sunlight back into space as they expanded, the ice sheets cooled the climate and reinforced their own growth. Obviously, the Earth didn’t remain stuck in the freezer, so how did the planet thaw?
Earth has experienced intervals in the past that were much hotter than today, and those versions of Earth were different in other ways, including the shape and location of continents. This animation starts with the present day and runs backward through geologic time, highlighting the hottest periods in Earth's past: the Paleocene-Eocene Thermal Maximum, 56 million years ago; the Cretaceous Hothouse, 100 million years ago; the Neoproterozoic (the end of the Proterozoic Eon), 700 million years ago; and the Hadean, 4 billion years ago, when Earth was first forming. NOAA Climate.gov animation, adapted NOAA Climate.gov animation, adapted from Crameri, F., G.E. Shephard, and E.O. Straume (2022, Pre-print), The open collection of geoscience graphics, EarthArXi (https://doi.org/10.31223/X51P78). Geologic maps available via the open-access s-Ink.org repository (http://s-Ink.org).
Even while ice sheets covered more and more of Earth’s surface, tectonic plates continued to drift and collide, so volcanic activity also continued. Volcanoes emit the greenhouse gas carbon dioxide. At various times in Earth’s history, continental-scale expanses of magma—known as large igneous provinces—may have released much greater quantities of greenhouse gases than today’s volcanoes. In our current, mostly ice-free world, the natural weathering of silicate rock by rainfall consumes carbon dioxide over geologic time scales of tens to hundreds of thousands of years. During the frigid conditions of the Neoproterozoic, rainfall became rare, and most rocks were covered with ice. With seismic activity churning out carbon dioxide and little or no rainfall to weather rocks and consume the greenhouse gas, temperatures climbed, unabated. Remarkably, our planet may have experienced some of its hottest temperatures sandwiched between some of its coldest temperatures.
What evidence do scientists have that all this actually happened some 700 million years ago? Some of the best evidence is "cap carbonates" lying directly over Neoproterozoic-age glacial deposits. Cap carbonates—layers of calcium-rich rock such as limestone—only form in warm water.
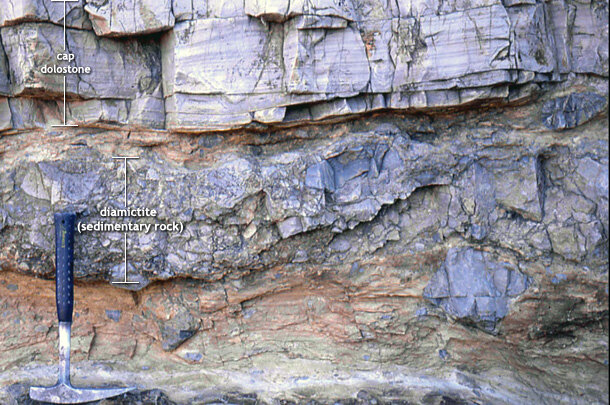
Rock formation in Namibia that shows a type of rock that only forms in warm water (cap dolostone) lying directly over a type of jumbled sedimentary rock, dated to 635 million years ago, that is commonly found at the margin of glaciers (diamictite). Image from teaching slides available at SnowballEarth.org.
The fact that these thick, calcium-rich rock layers sit directly on top of rock piles left behind by retreating glaciers indicates that temperatures rose significantly near the end of the Neoproterozoic, perhaps reaching a global average higher than 90° Fahrenheit. (Today's global average is lower than 60°F.) To be clear, the “rapid” change from cold conditions to hot conditions would have been fast in geologic terms but not necessarily in human terms. Changes in carbon dioxide levels and global temperature may have taken thousands of years, and the accumulation of cap carbonate rocks might have taken as long as hundreds of thousands of years.
The tropical Arctic
A Smithsonian Institution project has tried to reconstruct temperatures for the Phanerozoic Eon, or roughly the last half a billion years. Preliminary results released in 2019 showed warm temperatures dominating most of that time, with global temperatures repeatedly rising above 80°F and even 90°F—much too warm for ice sheets or perennial sea ice. About 250 million years ago, around the equator of the supercontinent Pangea, deserts predominated, thanks to a combination of heat and aridity.
Animation of reconstructed ("PhanDA") global average surface temperature (gray line) over the past 485 million years. (static image) The color-coded bar across the top shows cooler (blue) versus warmer (red) climates, with darker colors indicating greater hot or cold extremes. In general, polar ice sheets likely existed during blue-coded periods. The shading around the temperature line indicates temperature likelihood. The data ends with the average temperature over the Holocene, which spans the past 11,700 years. (Although this period includes modern global warming, its impact on the multi-millennial temperature estimate is minimal.) Past temperatures were estimated by combining geological data with climate model simulations. NOAA Climate.gov animation adapted from original figure in Judd, E. J., Tierney, J. E., Lunt, D. J., Montañez, I. P., Huber, B. T., Wing, S. L., & Valdes, P. J. (2024). A 485-million-year history of Earth’s surface temperature. Science, 385(6715), eadk3705. https://doi.org/10.1126/science.adk3705
Geologists and paleontologists have found that in the last 100 million years, global temperatures have peaked twice. One spike was the Cretaceous Hot Greenhouse roughly 92 million years ago, about 25 million years before Earth’s last dinosaurs went extinct. A 2024 paleoclimate reconstruction named PhanDA (Phanerozoic Data Assimilation) found a strong correlation between temperature and carbon dioxide during the Paleozoic (from the start of the reconstruction at 485 million years ago through 250 million years ago) and the Cenozoic (the last 65 million years) but did not find a similarly strong link during the age of the dinosaurs. So, the precise cause of the Cretaceous Hot Greenhouse will need continued research, but the fossils indicate a very warm planet. Temperatures were so high that champsosaurs (crocodile-like reptiles) lived as far north as the Canadian Arctic, and warm-temperature forests thrived near the South Pole.
Another hothouse period was the Paleocene-Eocene Thermal Maximum (PETM) about 56 million years ago. During much of the Paleocene and early Eocene, the poles were free of ice caps, and palm trees and crocodiles lived above the Arctic Circle. Though not quite as hot as the Cretaceous hothouse, the PETM saw average global surface temperature rise about 6°C (11°F) in less than 10 millennia. That figured among the fastest periods of warming observed in the geological record, but as the Smithsonian’s Scott Wing explains, continued high greenhouse gas emissions and the projected amount of warming they are likely to cause over the next few centuries could amount to roughly the same amount of warming at a rate 10 times faster.
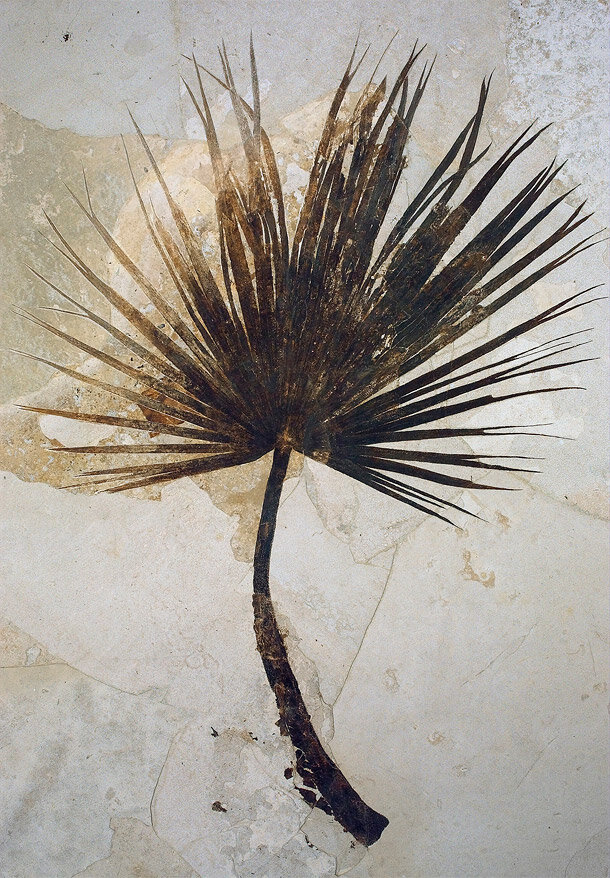
Around the time of the Paleocene-Eocene Thermal Maximum, much of the continental United States had a sub-tropical environment. This fossil palm is from Fossil Butte National Monument, Wyoming. Image courtesy U.S. National Park Service.
During the PETM, the global mean temperature appears to have risen by as much as 5-8°C (9-14°F) to an average temperature as high as 34°C (93°F). (Again, today’s global average is shy of 60°F.) At roughly the same time, paleoclimate data like fossilized phytoplankton and ocean sediments record a massive release of carbon dioxide into the atmosphere, at least doubling or possibly even quadrupling the background concentrations.
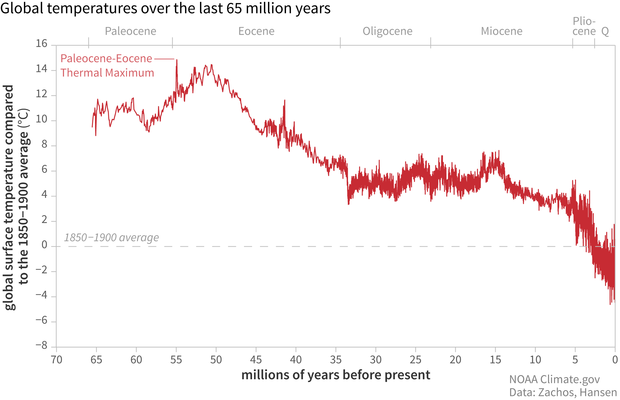
Global surface temperatures were generally high throughout the Paleocene and Eocene, with a particularly warm spike at the boundary between the two geological epochs around 56 million years ago. Temperatures in the distant past are inferred from proxies, in this case, oxygen isotope ratios from fossil foraminifera, single-celled marine organisms. "Q" stands for Quaternary. Graphic produced using data from Zachos and Hansen, with help from Dr. Carrie Morrill, Director of the World Data Service for Paleoclimatology.
It is still uncertain where all the carbon dioxide came from and what the exact sequence of events was. Scientists have considered the drying up of large inland seas, volcanic activity, thawing permafrost, release of methane from warming ocean sediments, huge wildfires, and even—briefly—a comet. In recent years, evidence has emerged that huge volcanic eruptions occurred in North America at the time of the PETM, and these volcanoes were a likely source of at least some of the carbon dioxide.
Like nothing we’ve experienced
Earth’s hottest periods—the Hadean, the late Neoproterozoic, the Cretaceous Hot Greenhouse, the PETM—all occurred millions of years before humans existed. That doesn’t mean we aren’t warming the planet now. In fact, studying past hothouse periods confirms the major role carbon dioxide plays in heating the Earth–no matter where it comes from.
Since 1800, carbon dioxide has risen 100-200 times as fast as when the Earth thawed out of its most recent glacial period between 17,500 and 11,500 years ago. Since 1850, global surface temperatures have risen roughly 0.11°F (0.06°C) per decade. Since 1982, they have risen 0.36°F (0.20°C) per decade. Earth’s fossil record links sudden climate change to extinction, for instance in marine invertebrates and marine mammals. Humans won’t likely go extinct, but losing the climate stability that has persisted throughout the entire history of civilization will mean unprecedented adaptation challenges: sea level rise and loss of coastal infrastructure, shifts in regional climate that affect food production, loss of dependable water supplies, more floods and wildfires, and an increased spread of infectious diseases.
No people lived on Earth for most of its history; we played no part in the planet’s hothouse conditions of the ancient past. But the planet’s history shows us that carbon dioxide has a strong influence on climate, and that rapid climate change causes major dislocation to animals and plants. We can learn from Earth’s history how our climate system works. These lessons from the past make it clear that we are now the ones changing global climate. Our role is undeniable, but so is our ability to change the future in ways that will make life better for people and other living things in generations to come.
References
British Geological Survey. Impacts of climate change. Accessed February 7, 2022.
The Cenozoic CO2 Proxy Integration Project (CenCO2PIP) Consortium. (2023). Toward a Cenozoic history of atmospheric CO2. 382(6675), eadi5177.
Engber, D. (2012, July 5). What's the hottest the Earth has ever gotten?
Eurekalert. (2023, December 7). Geoscientists map changes in atmospheric CO2 over past 66 million years. Accessed December 24, 2023.
Glavovic, B.C., Dawson, R., Chow, W., Garschagen, M., Haasnoot, M., Singh, C., Thomas, A. (2022).: Cross-Chapter Paper 2: Cities and Settlements by the Sea. In: Climate Change 2022: Impacts, Adaptation and Vulnerability. Contribution of Working Group II to the Sixth Assessment Report of the Intergovernmental Panel on Climate Change.
Hearling, T.W., Harvey, T.H.P., Williams, M., Leng, M.J., Lamb, A.L., Wilby, P.R, Gabbott, S.E., Pohl, A., Donnadieu, Y. (2018). An early Cambrian greenhouse climate. Science Advances, 4(5), easar5690.
Hoffman, P.F. (2009). Snowball Earth. Accessed February 4, 2014.
Hoffman, P.F., Schrag, D.P. (2002). The snowball Earth hypothesis: testing the limits of global change. Terra Nova. 14(3), 129-155.
Huber, B.T., MacLeod, K.G., Watkins, D.K., Coffin, M.F. (2018). The rise and fall of the Cretaceous Hot Greenhouse climate. Global and Planetary Change, 167, 1-23.
Intergovernmental Panel on Climate Change (IPCC). (2013). IPCC Fifth Assessment Report - Climate Change 2013: The Physical Science Basis. Summary for Policymakers.
Judd, E.J., Tierney, J.E., Lunt, D.J., Montañez, I.P., Huber, B.T, Wing, S.L., Valdes, P.J. (2024). A 485-million-year history of Earth’s surface temperature. Science, 385, 6715, doi:10.1126/science.adk3705.
Klages, J.P., Salzmann, U., Bickert, T., Hillenbrand, C.-D., Gohl, K., Kuhn, G., Bohaty, S.M., Titschack, J., Müller, J., Frederichs, T., Bauersachs, T., Ehrmann, W., van de Flierdt, T., Pereira, P.S., Larter, R.D., Lohmann, G., Niezgodzki, I., Uenzelmann-Neben, G., … Dziadek, R. (2020). Temperate rainforests near the South Pole during peak Cretaceous warmth. Nature, 580(7801), 81–86.
Lindsey, R. (2006, March 1). Ancient crystals suggest earlier ocean. NASA Earth Observatory. Accessed February 4, 2014.
Malanoski, C.M., Farnsworth, A., Lunt, D.J., Valdes, P.J., Saupe, E.E. (2024). Climate change is an important predictor of extinction risk on macroevolutionary timescales. Science, 383(6687), 1130–1134.
McInerney, F. A., & Wing, S. L. (2011). The Paleocene-Eocene Thermal Maximum: A Perturbation of Carbon Cycle, Climate, and Biosphere with Implications for the Future. Annual Review of Earth and Planetary Sciences, 39(1), 489–516.
Paleoclimatology: How can we infer past climates? Microbial Life Educational Resources, Montana State University. Accessed June 9, 2020.
Retallack, G.J. (2013). Permian and Triassic greenhouse crises. Gondwana Research, 24(1), 90-103.
Royer, D.L., Berner, R.A., Montañez, I.P., Tabor, N.J., Beerling, D.L. (2004). CO2 as a primary driver of Phanerozoic climate. GSA Today, 14( 3), 4-10.
Scientific American Frontiers. (2000, December 19). Deep freeze.[www.pbs.org/saf/1103/features/deepfreeze.htm] Accessed February 4, 2014.
Sherwood, S.C., Huber, M. (2010). An adaptability limit to climate change due to heat stress. In Proceedings of the National Academy of Sciences (Vol. 107, Issue 21, pp. 9552–9555). Proceedings of the National Academy of Sciences.
Sleep, N. H. (2010). The Hadean-Archaean Environment. Cold Spring Harbor Perspectives in Biology, 2(6). doi: 10.1101/cshperspect.a002527
Song, H., Kemp, D.B., Tian, L., Chu, D., Song, H., Dai, X. (2021). Thresholds of temperature change for mass extinctions. Nature Communications, 12(1).
Sun, Y., Joachimski, M.M., Wignall, P.B., Yan, C., Chen, Y., Jiang, H., Wang, L., Lai, X. (2012). Lethally hot temperatures during the early Triassic Greenhouse. Science, 338(6105), 366-370.
Terrestrial Paleoclimate. Eocene latitudinal gradients.[paleoclimate.stanford.edu/research/eocene-latitudinal-gradients] Stanford University School of Earth Sciences. Accessed February 4, 2014.
Thomas, T.B., Catling, D.C. (2024). Three-stage formation of cap carbonates after Marinoan snowball glaciation consistent with depositional timescales and geochemistry. Nature Communications 5(1), 7055.
University of California Museum of Paleontology. The Archean Eon and the Hadean and The Eocene Epoch. Accessed February 4, 2014.
U.S. National Science Foundation. (2022, January 11). Climate change factors in the fossil record that accelerate mass extinction. Accessed December 24, 2023.
Vecellio, D.J., Wolf, S.T., Cottle, R.M., Kenney, W.L. (2022). Evaluating the 35°C wet-bulb temperature adaptability threshold for young, healthy subjects (PSU HEAT Project). Journal of Applied Physiology. 132(2), 340-345.
Voosen, P. (2019). Project traces 500 million years of roller-coaster climate. Science, 364(6442), 716-717.