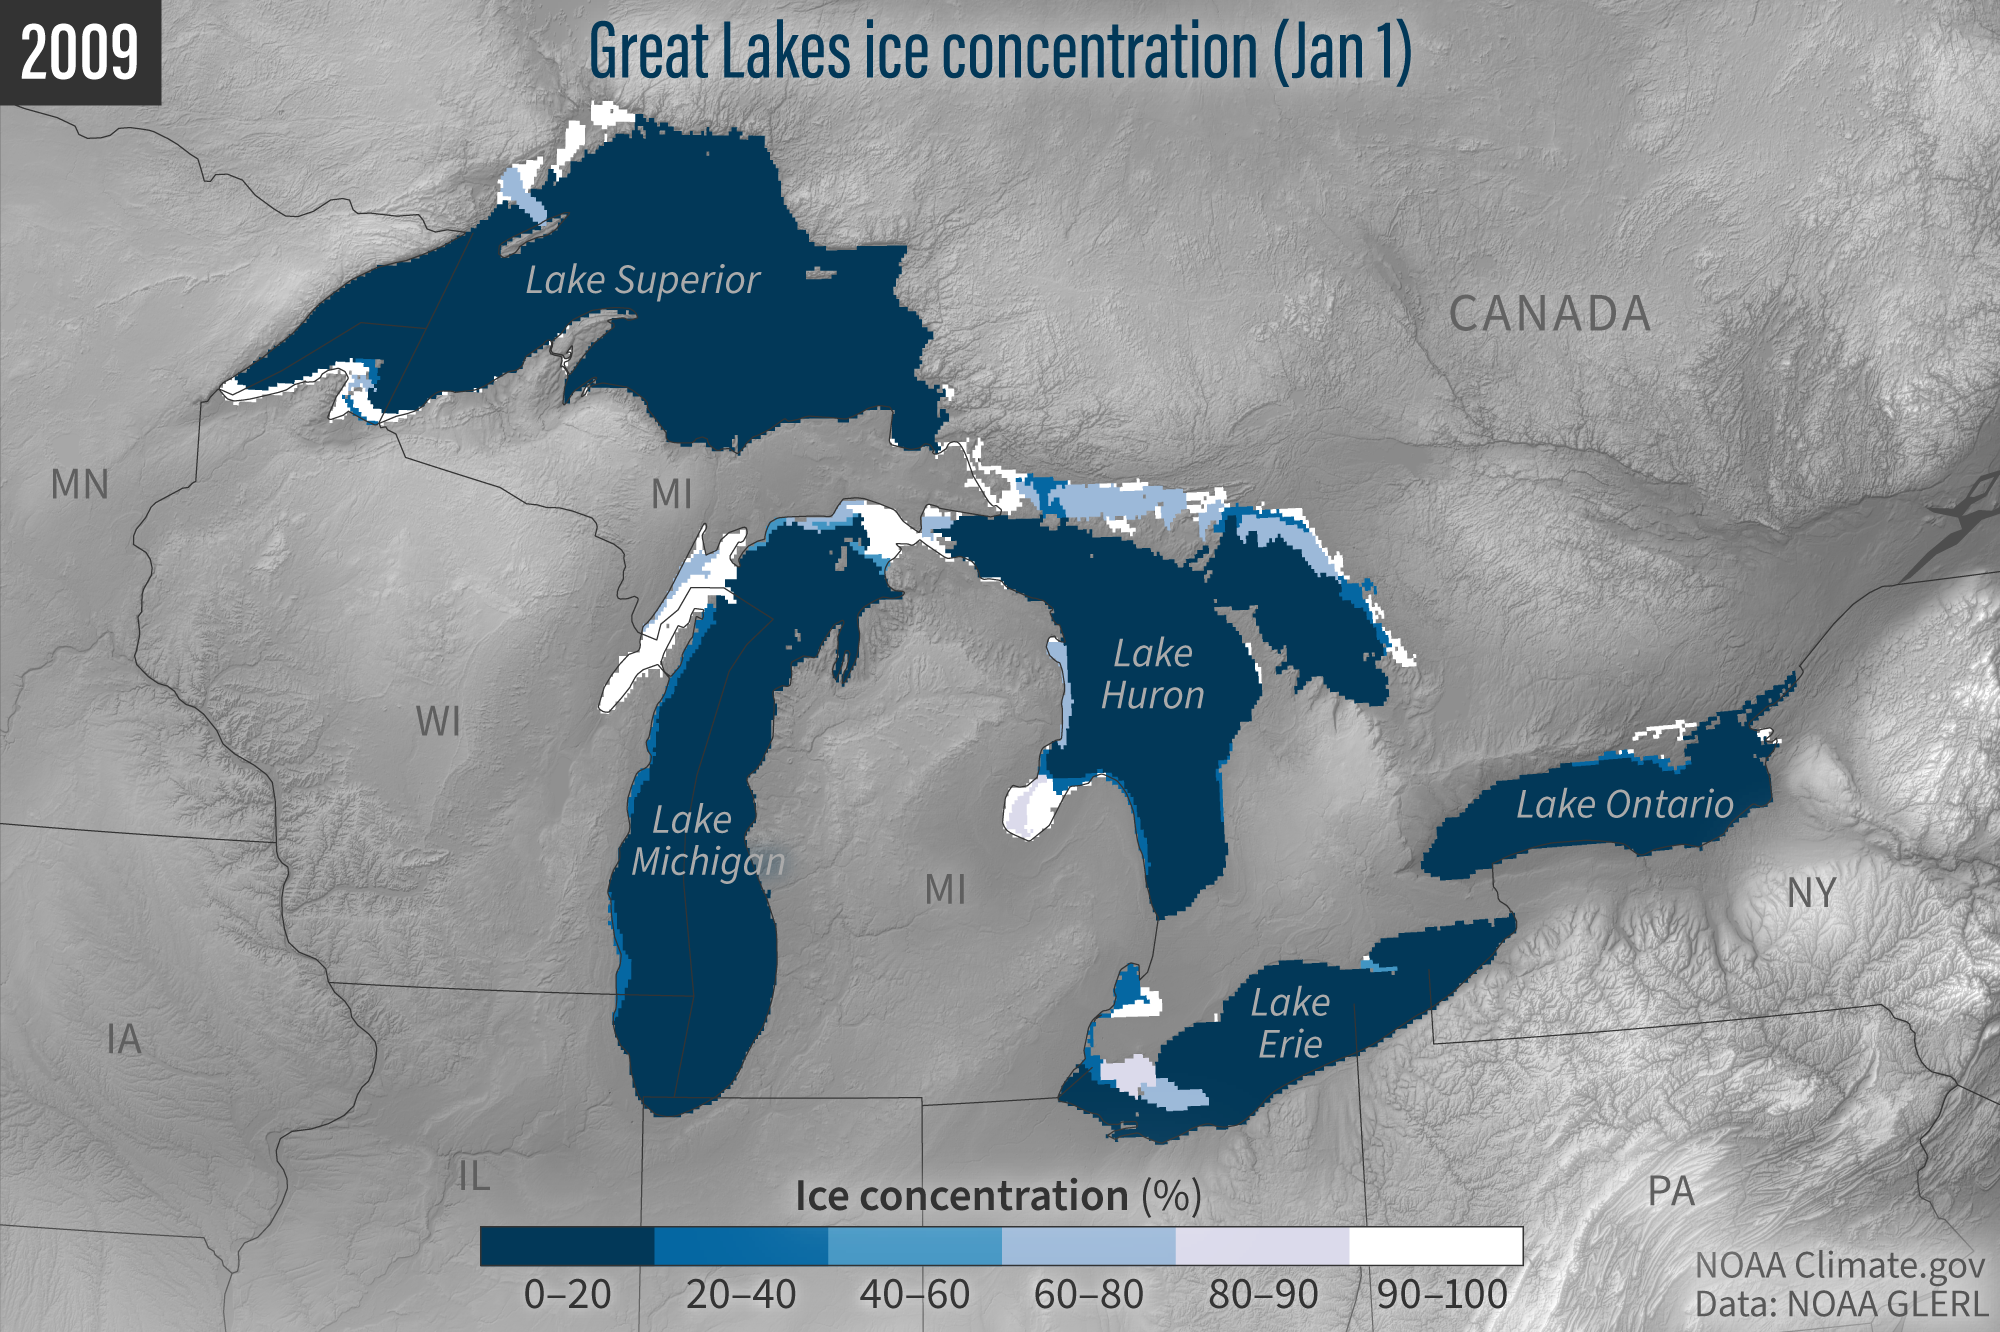
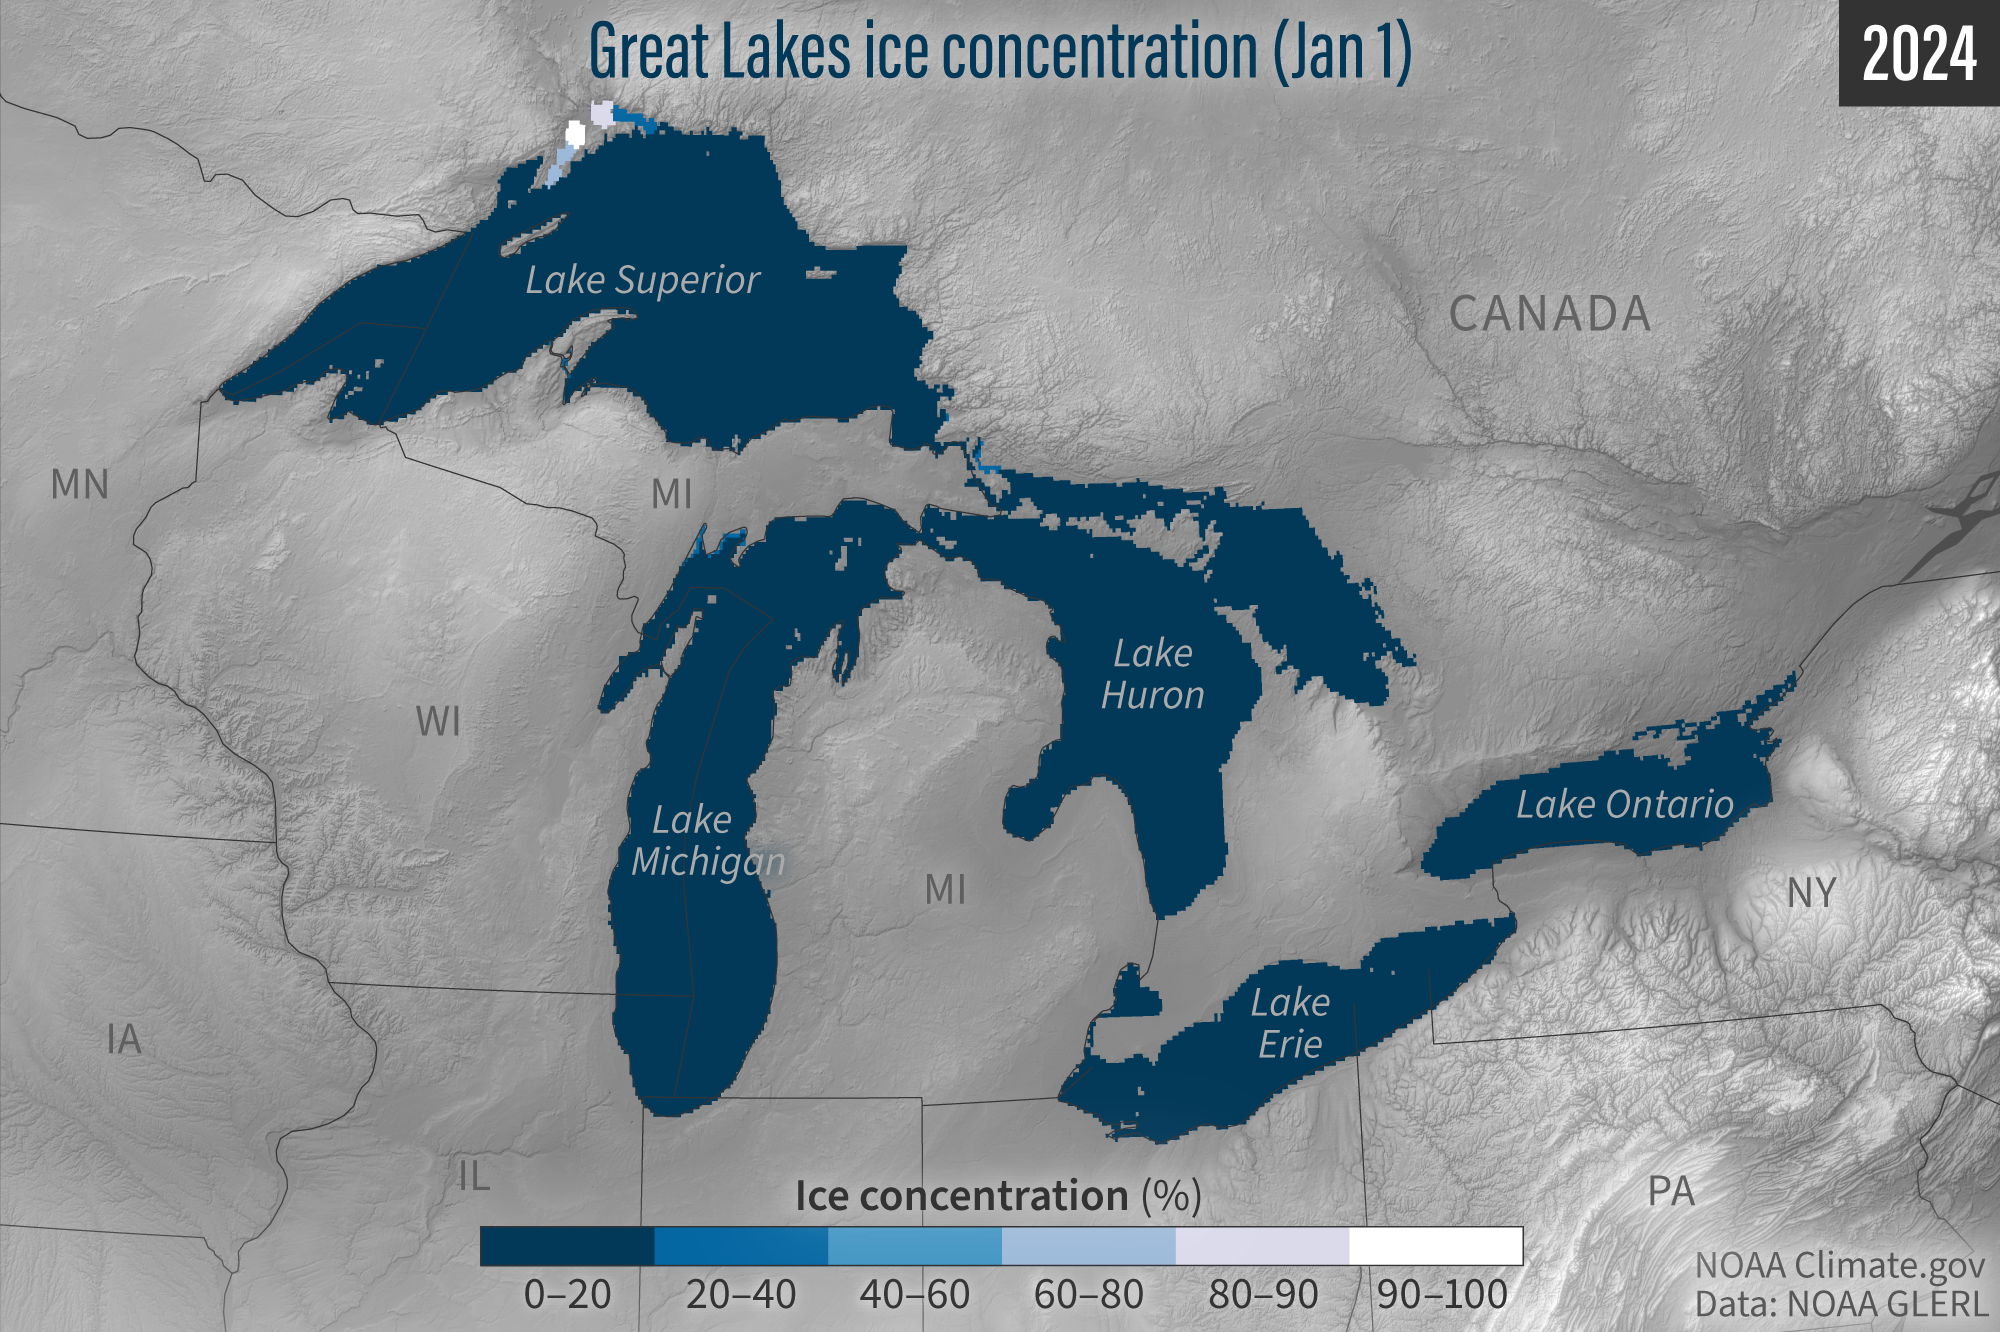
Click and hold to drag slider. Percent ice cover on the Great Lakes on January 1, 2009 (left) and January 1, 2024 (right). Shades of blue indicate ice concentration, with the darkest shade of blue indicating areas where 0 percent of the water’s surface is frozen, and white indicating areas where the water is entirely frozen over. The image on the left shows what near-average ice cover on January 1 can look like, at around 10 percent. Meanwhile the image on the right shows less than 1 percent ice cover. Map by NOAA Climate.gov, based on data provided by the U.S. Naval Ice Center.
Well above average temperatures across the Great Lakes in December, paired with the lack of any major Arctic air blasts across the region early in the winter season, led to record-low ice coverage to start the year. Ice coverage for the entire basin was a measly 0.35 percent on January 1, the lowest ice coverage since records at NOAA Great Lakes Environmental Research Laboratory (GLERL) began in 1973, and well under the historical average of nearly 10 percent for that date.
Read more about the importance of this long-term ice data from NOAA Research.
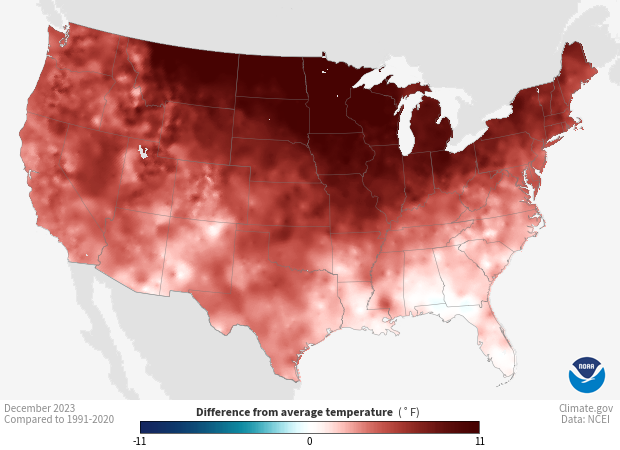
Monthly temperature anomalies for December 2023 compared to the 1991-2020 average. Red areas were warmer than the 30-year average for the month, and blue areas were cooler. White and very light areas had temperatures close to the long-term average. Much the country experienced warmer than average temperatures in December 2023, with the largest anomalies occurring across the northern tier of the country, including areas surrounding the Great Lakes. Map by NOAA Climate.gov, based on data from the National Centers for Environmental Information (NCEI).
But low ice cover early in the season doesn’t always mean the whole season will be low. For example, 2019 started the year with only 3.9 percent ice coverage and ended up with a maximum ice extent of 80.9 percent, which is well above the average of 53 percent. However, 2002, which also began the year with nearly 3 percent ice coverage, holds the record for lowest maximum ice extent at only 11.8 percent, proving just how volatile and unpredictable ice coverage can be year to year.
Since the start of this year, ice coverage has risen to nearly 7 percent, as of January 16. A large chunk of the freezing has occurred in recent days due to a major cold snap that has engulfed much of the United States in bitterly cold temperatures. (Could the polar vortex partly be to blame?)
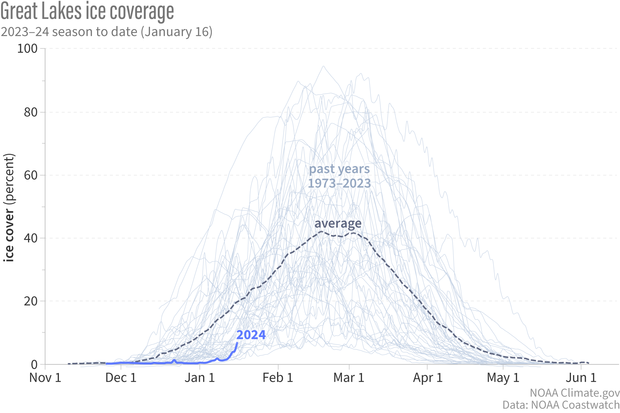
Graph showing seasonal ice coverage across the Great Lakes compared to the average. The dashed line is the historical average of ice cover, the light gray lines are each season of data from 1973 to 2023 and the blue line is the season's data through January 16, 2024. January 1, 2024 had record-low ice cover. Graph by NOAA Climate.gov, based on data from NOAA Coastwatch.
In the very short term, the ice extent across the lakes could continue to grow as this week’s cold snap continues. However above-average temperatures are favored across the region in the second half of January according to the 6-10 day and 8-14 day temperature outlooks issued on January 16 by the Climate Prediction Center. If these temperatures are warm enough, recent ice gains could halt or even reverse, reducing overall January ice coverage.
Great Lakes ice cover does not always grow steadily and continuously throughout the winter; several ups and downs are possible throughout the season. The amount of ice tends to vary widely from year to year based on the weather conditions and overall climate patterns (such as ENSO) in place in any given year. That being said, this is the time of year that Great Lakes ice coverage begins to increase as we approach the coldest days of the year on average. So, there is still plenty of time for ice extent across the Great Lakes to accumulate this season as temperatures allow. Something to keep in mind, though, is that we are also experiencing a strong El Niño which typically favors warmer-than-normal temperatures across the region in the winter.
The globe continues to warm due to human-induced climate change. With higher global surface temperatures, there is less potential for large amounts of ice cover, a trend which has been seen across the Arctic in recent decades. The Midwest and the Northeast (which surround the Great Lakes) are experiencing the greatest amount of winter warming across the United States, and according to the Fifth National Climate Assessment, the Great Lakes are among the fastest-warming lakes in the world. There has been an observed downward trend in Great Lakes annual maximum ice cover over the last 40 years, but year to year, there can still be shifts between winters of extreme cold and unprecedented ice cover and mild winters with below-normal ice cover.
Regardless of what this year holds, NOAA will continue to monitor this year’s ice extent and what impacts may arise.