NOAA Scientists Measure Earth's Changing Atmosphere
Details
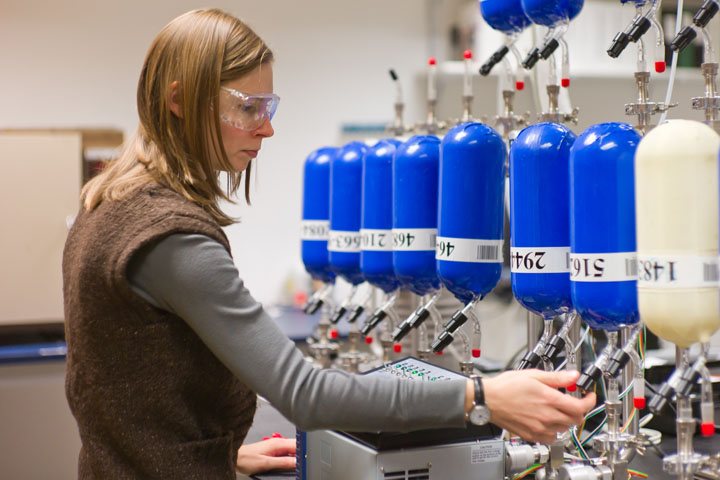
In the photo above, Molly Heller processes an air-filled flask in NOAA’s Earth System Research Laboratory in Boulder, CO. Week in and week out, Heller and her colleagues unpack sealed glass flasks shipped back to Boulder from dozens of remote sites around the world. What’s inside is priceless: air captured from a site near Tasmania’s Cape Grim; from Summit, Greenland; the Canary Islands; the South Pole.
The samples arrive weekly from most of the sites in an international network of observation stations, and Heller and her colleagues process them, getting them ready for analysis at NOAA and the University of Colorado. Researchers measure the amounts of up to 20 gases, including those known to cause greenhouse warming and others involved in depletion of Earth’s protective ozone layer.
Among their contributions to climate and Earth science, the observations underpin projects like the Annual Greenhouse Gas Index, which NOAA released with 2010 numbers today. The AGGI is a gauge of the climate warming influence of greenhouse gases measured around the world and compared with the “reference” year of 1990. The AGGI shows a steady upward trend, reaching 1.29 in 2010. This means that the heating effect of greenhouse gases added to the atmosphere by human activities has increased by 29 percent since 1990.
The air sample analyses begin in a laboratory at NOAA, and rely on high-precision instruments carefully calibrated with standard gases used by researchers around the world. NOAA scientists carefully draw air from the flasks to measure the amounts of several chemicals, including the greenhouse gases carbon dioxide, methane, and nitrous oxide. Then, the flasks move on to a laboratory down the road at the university, where researchers use a different suite of instruments to make more measurements. All data are available to the public.
“I’m part of a really great mission, to study the changing atmosphere. This is something I’m passionate about,” Heller said.
To accurately track changes in the atmosphere requires a long-term commitment to collecting the data—NOAA has been doing it since the late 1960s—as well as great patience. Glass cracks, despite the great care taken in packing the flasks. Seals break and contaminated samples need to be tossed. Shipping rules and charges change unexpectedly. At some sites, samplers have reliable access to mail services; others don’t.
“By definition, this is not going to be convenient because we need remote sites,” Heller said. “They’re not out the back door.”
Related Articles
An Upwelling Crisis: Ocean Acidification
Carbon Dioxide: Earth’s Hottest Topic is Just Warming Up
Related Images
Tracking Greenhouse Gases from NOAA’s Tall Towers
Soarin’ Over California
Ocean Acidification, Today and in the Future
Global Climate Dashboard: Annual Greenhouse Gas Index
Related Videos
Interview with Jim Butler about NOAA’s 2010 update to the Annual Greenhouse Gas Index
800,000-year History of Atmospheric Carbon Dioxide
The Origin and Impacts of Ocean Acidification
What Is Causing Global Climate Change?
