November global temperature highest on record
Details
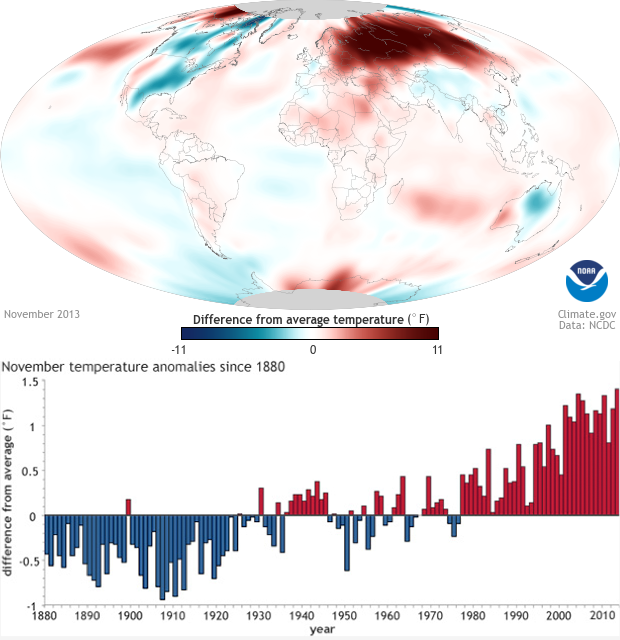
The November 2013 national and global climate updates are a perfect reminder that our local weather in any particular month is not a good predictor of the status of the global climate. While much of the United States was cooler than average in November, the globe as a whole set a new record for warmth. It was the 37th November in a row that was warmer than average.
The map at right shows November 2013 surface temperatures compared to the 1981-2010 average. Darkest blue shows temperatures 11 or more degrees Fahrenheit cooler than average; darkest red shows temperatures 11 or more degrees warmer than average. The graph below the map shows the history of November temperatures since 1880 compared to the 20th century average.
The most dramatic difference from normal November temperatures occurred in Russia, which had its warmest November since national records began in 1891. Some areas of the Urals, Siberia, south of the Far East region, and on the Arctic islands in the Kara Sea had temperatures that were more than 14°F (8°C) higher than the monthly average.
November marks the end of meteorological autumn (in the Northern Hemisphere) and spring (Southern Hemisphere). The global surface temperature for the season was the second-warmest on record. Year-to-date temperatures are running above the 20th century average by 1.12°F, bringing 2013 into a tie with 2002 as having the 4th warmest January-November period on record.
Map by NOAA Climate.gov, based on GHCN data originally provided by the National Climatic Data Center (NCDC) and interpolated by the NOAA Environmental Visualization Lab. Graph by NOAA Climate.gov based on data from the NCDC Climate at a Glance website. Caption adapted from the November 2013 Global Climate Analysis from the NCDC.
On the Web:
