Reconstructing Weather to Predict Climate
During World War II, the Allied Forces needed to understand weather patterns in parts of the world that were suddenly critical to military operations. What kinds of extreme winds might fighter planes encounter over foreign lands? When might ice on the Great Lakes thaw enough to resume shipping of materials and fuel in the spring?

A pilot in a “Wildcat” fighter receives the launch signal from the deck of the USS Makin Island in 1945. Photo courtesy of Naval History and Heritage Command.
Allied weathermen dug up sparse meteorological observations from the previous several decades and drew them out on paper maps, to figure out what weather patterns were associated with the surface conditions.
"They were sketching out the past to understand the future," said NOAA's Gil Compo, a climate researcher at NOAA's Earth System Research Laboratory, who stumbled upon the meteorologists' work during graduate school. Inspired, Compo began to wonder if he and his colleagues could use an updated "reanalysis" technique to serve a critical contemporary need-understanding and forecasting climate change.
Scientists seeking to understand how climate change is affecting Earth's weather patterns need to have a precise understanding of natural variability-the ordinary ups and downs of weather that make one year hotter or cooler, or wetter or drier than average. To detect and quantify underlying climate change, researchers must be able to look beyond those ups and downs.
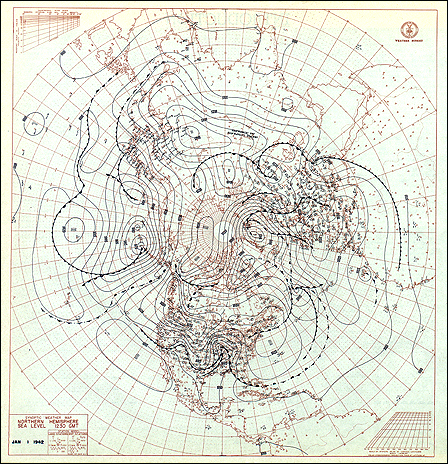
Hand-drawn chart of Northern Hemisphere weather for January 1, 1942. Courtesy of NOAA’s Climate Database Modernization Program.
"We'd also like to be able to put current climate anomalies, such as drought or other extreme weather, in the context of the past," Compo said. "How have these events varied in the past, and how does that compare with what we see today?"
Finally, climate scientists need reliable records of current and past weather patterns, to check and improve their models. Examining many instances of similar weather patterns, using observations from the ground to the upper reaches of the atmosphere, can help modelers improve their systems' abilities to reproduce past events and predict future conditions.
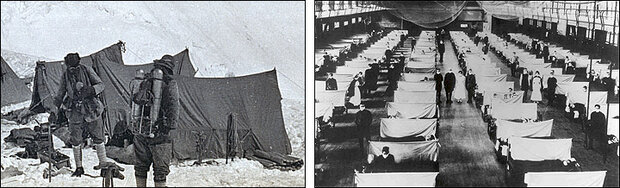
At left, climbers prepare for their 1924 attempt to reach the summit of Mount Everest. Photo courtesy of Royal Geographical Society. On the right, doctors and nurses tend flu patients in an Iowa gymnasium. Photo courtesy of U.S. Department of Health and Human Services.
A reconstruction of past weather conditions could serve another group of researchers, too-historians trying to understand how weather patterns and climate variability influenced important events, from a deadly 1924 expedition on Mount Everest to a devastating drought in India in 1918, an event that may have contributed to the horrific global flu pandemic that occurred that year.
Old Data, New Models
In 2002, Gil Compo, Jeff Whitaker, and Prashant Sardeshmukh, all with NOAA's Earth System Research Laboratory and the affiliated Cooperative Institute for Research in Environmental Sciences, CIRES, launched their reanalysis project. Their goal was to build a time machine-a set of data that would give researchers a complete and detailed portrait of the planet's weather for the last century.
Growing international understanding about the importance of historic weather data was critical to the project. Large numbers of weather descriptions and barometer readings taken by ship captains, Jesuit monks, and last century's scientists have been compiled and archived. NOAA's National Climatic Data Center-particularly the Climate Database Modernization Program-and the National Center for Atmospheric Research were already leading an effort to collect and digitize data found in old weather logs. Additionally, the Atmospheric Circulation Reconstructions over the Earth (ACRE) initiative is now coordinating international efforts to digitize old data.
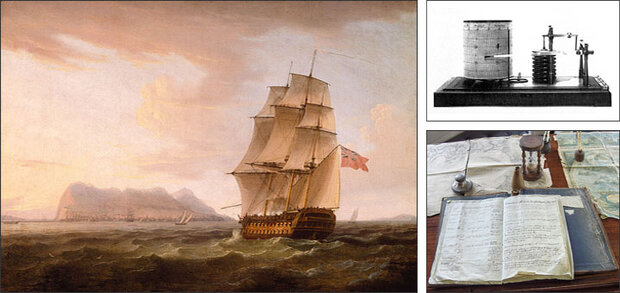
For several centuries, ships recorded their location and detailed weather observations in handwritten logbooks. Several international projects are now involved with gathering, scanning, and transferring these data into computer-accessible formats. The image on the left, a painting by Thomas Whitcombe, shows a British ship with the Rock of Gibralter in the background. At upper right, a type of barometer commonly used on ships in the 1800s, courtesy of NOAA. At lower right, the logbook of the Grand Turk, a replica of an historic British ship, courtesy of Georges Jansoone.
.jpg)
At the same time that historical observations were becoming available, Compo and his colleagues were working on a technique that might help them relate weather conditions with barometric pressure patterns at Earth's surface. The technique, called ensemble Kalman filtering, is a mathematical way to take reasonable guesses about weather conditions that occurred at a place and time, and to improve those guesses by comparing them with actual observations. Their technique blends observations and numerical weather modeling, using a group, or "ensemble," of computer predictions. The technique allows researchers to "hindcast" historical conditions for locations where no observations were taken. And because the process uses ensembles of predictions, the researchers can also calculate the level of uncertainty for specific sets of conditions. That means they know which historical reconstructions are most likely to be accurate, and which are little better than guesses.
Both filtering and numerical weather prediction require enormous numbers of computations. Producing the historical weather maps for a month takes a full day of supercomputer time. Recognizing their need for huge amounts of supercomputer time, Compo, Whitaker, and Sardeshmukh wrote a proposal to the Department of Energy that would give them access to processing time on some of the world's fastest supercomputers.
Many of the group's colleagues doubted the idea would work, Compo admitted. In essence, his team's proposal was to generate a snapshot of the atmosphere for the entire planet four times a day, back to the 1870s-based primarily on sparse pressure observations made at Earth's surface. The lack of measurements from the upper atmosphere was the troubling issue. In weather forecasting today, "forecasts are widely understood to fail without upper air data," Compo said. Widely held beliefs don't always remain true, though. Current experiments show that forecasts made with the ensemble Kalman filter or another new technique, called 4D-var, are actually relatively accurate, even without upper atmosphere readings, about as good as modern weather forecasts three days in advance.
Success and Verification
The Department of Energy accepted the innovative proposal submitted by Compo's team, granting them access to more than 4 million hours of processing time on supercomputers at Lawrence Berkeley National Laboratory and more than 2 million hours at Oak Ridge National Laboratory. Backed by that computing power, the research team used a numerical weather prediction model from NOAA's National Centers for Environmental Prediction and the ensemble Kalman filter to stitch the sparse historic observations together into huge datasets that describe atmospheric conditions.
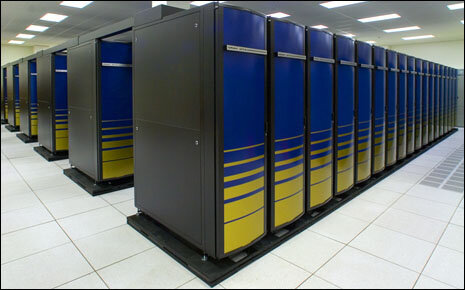
The Franklin supercomputer system at Lawrence Berkeley National Laboratory. Courtesy of National Energy Research Scientific Computing Center.
The resulting dataset-the 20th Century Reanalysis Project-is now available, with three-dimensional reconstructions of the atmosphere for every six hours between 1891 and 2008. "We have our time machine," Compo said, "and the techniques we're using will continue to extend our ability to see back in time. Reconstructions as far back as 1870 may be completed in 2010."
Reanalysis can seem somewhat magical, Compo said. But the work relies on assumptions that are based in physical reality-primarily mathematical equations that describe how weather patterns flow across the planet today. And most importantly, the scientific team can check the accuracy of their work in several ways.
"First, we can go back to a date in recent history, say sometime in 2005, and throw out all the weather observations except surface pressure," Compo said. Using only the surface pressure as input, we run the reanalysis, and compare our results with actual observations captured by weather balloon, satellite, and other modern tools. Results from this type of test have shown that surface pressure observations alone can be used to reconstruct a three-dimensional portrait of the atmosphere with the accuracy of a three-days-out weather forecast-that's "very good," Compo said.
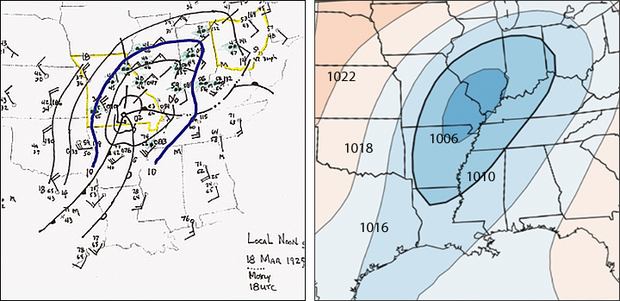
On the left, a manual analysis of the atmosphere for the Tri-State Tornado Outbreak of March 18, 1925, the deadliest tornado in U.S. history. Image courtesy of Robert Maddox, University of Arizona. On the right, 20th Century Reanalysis data, which did not use any of the observations shown in the manual analysis, produced a nearly identical pattern of air pressure. Contours show pressure in millibars. Image courtesy of Gil Compo.
The team has also compared their historic weather reconstructions with other, more detailed reconstructions made independently. In 1925, for example, a massive tornado tore through Missouri, Illinois, and Indiana, killing more than 600 people. Researchers from the University of Oklahoma collected detailed weather records associated with the event, and conducted a regional reanalysis to reproduce the conditions that generated the storm. Eliminating all data used in that regional reconstruction (except surface pressures), Compo and his team reconstructed a dataset that was nearly identical.
Reanalysis and History
An Attempt to Summit Mount Everest
In 1924, British climbers George Mallory and Andrew "Sandy" Irvine attempted to reach the summit of Mount Everest-and disappeared in a storm. Mallory's body was found 75 years later, in 1999. Irvine's body has never been found.
G.W. Kent Moore of the University of Toronto's Department of Physics has long been interested in high-altitude meteorology, especially around Mt. Everest. "I was always fascinated by the disappearance of the climbers who made the first serious attempt to summit Mt. Everest," said Moore. "Mallory and Irvine disappeared into what was described as some sort of blizzard. We're still not certain if they made the summit or not."
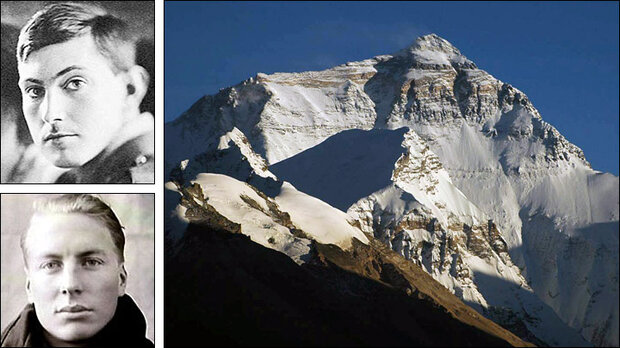
George Mallory (top) and Sandy Irvine (bottom) perished in their 1924 attempt to reach the summit of Mount Everest, shown here as viewed from a monastery in Tibet. Photo courtesy of Carsten Nebel.
Digging around in original records from the Royal Geographical Society, Moore was surprised to learn that during the expedition, pressure and temperature data had been collected at the base camp. These observations showed a huge pressure drop as the storm arrived. The decrease in pressure was 18 millibars-the largest drop that Moore had seen in the region's recorded history. This fact alone indicated that this was a much more serious storm than people originally thought. Interestingly these observations were published in 1926, but no discussion or comments on this major pressure drop ever developed.
Moore then found out about the 20th Century Reanalysis Project, and in 2009, he asked Compo for a look at the initial dataset, covering 1908-1958. In his investigation, Moore found that the pressure drop was actually due to a large-scale weather system called a "western disturbance." These systems are now known to be responsible for much of the bad weather in the Himalayas.
"What is remarkable about this incredibly rich data set is that it reconstructs the state of the atmosphere with surprising precision, and for the first time, we have a three-dimensional look at it," said Moore. "It's a wonderful tool for looking back in time."
Reanalyzing the 1918-19 El Niño
Another look into the past offered by data from the Reanalysis Project sheds light on events that occurred in the years 1918-19. By many measures, these were strange times: World War I was ending, and an influenza pandemic was racing across the globe, killing millions. In India, the failure of the summer's usual monsoon rains resulted in severe drought. New York was brutally cold in January of 1918, but bizarrely warm in late fall. The Atlantic hurricane season was a welcome bust. Now, data from the 20th Century Reanalysis Project suggest that the years were also marked by a severe El Niño, probably one of the strongest of the 20th century.
The new finding could help explain some of the observed anomalies in weather and disease during that period, said Benjamin Giese, an oceanographer at Texas A&M University. It might also help researchers better understand how El Niño events affect U.S. weather patterns, and how those may change in the future.
Giese collaborated with NOAA personnel and partners in his research, digging into the reanalysis data to better understand El Niño trends of the last century. El Niño-Spanish for "the child"-is the name climate scientists have given the occasional periods of Pacific Ocean warming that play havoc with global weather patterns. El Niño events intensify winter storms along the U.S. West Coast, as well as in the Gulf States and the Southeast. El Niño also dampens Atlantic hurricane formation and can increase the number of Pacific hurricanes.
"1918 saw one of the worst droughts of the 20th century in India," he said. "There was famine and a lack of potable water, thus a compromised population. It is clear that climate played a role in the mortality of people in India. This is an example of how climate can impact human health."
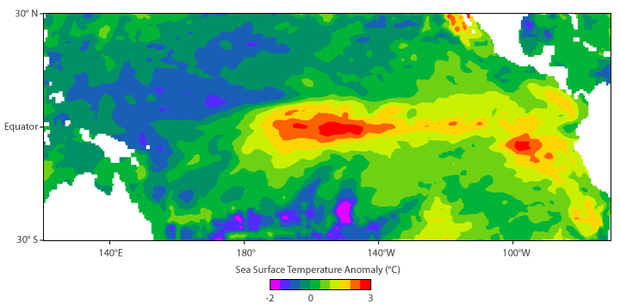
Sea surface temperature in the tropical Pacific Ocean for November 1918, as indicated by an ocean model that used 20th Century Reanalysis data as input. The model shows that an area of the Pacific Ocean was up to 3°C warmer than average, making this El Niño one of the most intense events of the 20th century, likely having a strong effect on precipitation in India. Image courtesy of Benjamin Giese, Texas A&M University.
Using reconstructed weather data as input for an ocean model, a research team at Texas A&M University discovered that the 1918-19 El Niño pattern was different from than those observed in recent years. Warming was strong in the central Pacific but not along the South American coast. Since most observations from 1918 were made along the coast, the region of greatest warming was missed, leading previous researchers to underestimate the strength of the El Niño event. "What people have been doing to look at past El Niños is to use very sparse datasets and extrapolate based on patterns we know about during recent years," Giese said. "But those patterns can change."
Next Up
A number of researchers in the U.S. and around the world are beginning to find and use the 20th Century Reanalysis data to further their own research. The research team is also beginning to dig deeper back in time. Producing reconstructions for years prior to 1870 will be challenging, the researchers know, because observations are increasingly rare before 1870, and instruments were less reliable.

Gil Compo. Courtesy of NOAA.
"We're going to see what we can do," Compo said. "I'd like to see if we can use data from the HMS Beagle to produce reconstructions." Evolutionary biologist Charles Darwin made his most famous expedition on that ship between 1831 and 1836, and ship captain Fitzroy took barometer readings along the way.
Compo said he finds it thrilling to be connected in this way with his "scientific forbearers," who took great risks to collect data. "Now, in ways they never could have imagined," he said, "we are going to use their data to figure out how weather and climate have changed during the past two centuries."
Katy Human is a writer and editor at NOAA's Earth System Research Laboratory and the Cooperative Institute for Research in Environmental Sciences at University of Colorado. Barb DeLuisi is a writer and communication specialist at NOAA's Earth System Research Laboratory. Linda Joy is a Public Affairs Specialist for NOAA's Office of Oceanic and Atmospheric Research.
Access 20th Century Reanalysis plots of sea level pressure for dates from 1891 through 2008. Contours on the Ensemble Mean SLP images (on the left) show reconstructed air pressure patterns. Colors on the plots indicate the certainty associated with the reconstruction in various regions.
References
Compo, G.P., J.S. Whitaker, and P.D. Sardeshmukh, 2006: Feasibility of a 100 year reanalysis using only surface pressure data. Bull. Amer. Met. Soc., 87, 175-190.
ASCR-Discovery: Reanalysis Project Targets Once-and-future Weather, Accessed January 25, 2010.
Compo, G.P., J.S. Whitaker, and P.D. Sardeshmukh, 2008: Bridging the Gap between Climate and Weather, Accessed February 5, 2010.