Wet spring linked to forecast for big Gulf of Mexico ‘dead zone’ this summer
The extremely wet 2019 spring that brought terrible flooding to large parts of the Missouri and Mississippi River watersheds has also set the stage for a very large ‘dead zone’ in the Gulf of Mexico later this summer. Last week, NOAA issued its annual forecast, saying that the summer dead zone—an area near the sea floor where there is little or no dissolved oxygen—may be just shy of 8,000 square miles in 2019, nearly as large as the record-setting area that occurred in 2017. The ecological impacts of the Gulf dead zone spread through the economy.
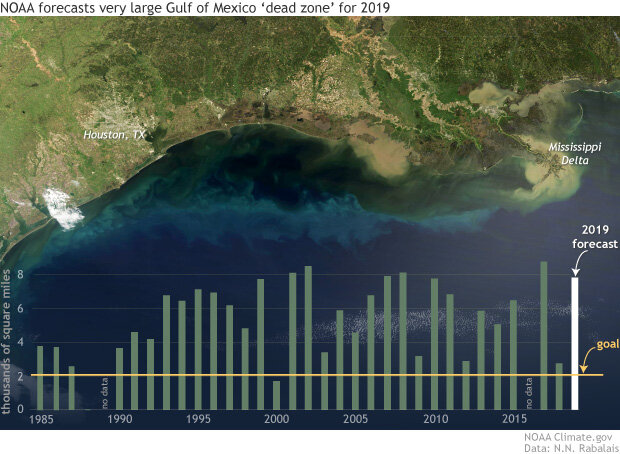
(backgound) Sediment, algae, and other plant-like microbes make colorful swirls in the Gulf of Mexico on March 21, 2019. Terra satellite image from Worldview. (graph) Annual area of low- or no-oxygen water (green bars) measured during ship surveys since 1985, including the forecast for 2019 (white bar), and the five-year average goal (yellow line) established by the prevention task force. Data from N. N. Rabalais and R. E. Turner, Louisiana State University & Louisiana Universities Marine Consortium, with funding from NOAA, National Centers for Coastal Ocean Science.
The Gulf of Mexico dead zone is one of the largest in the world, and it occurs every summer through a complex chain of events. As winter snow melts and spring storms arrive, river runoff washes into the Gulf carrying excess fertilizer from the region’s farms and wastewater pollution from cities and towns.
This spring surge in runoff feeds an overgrowth of algae and other plant-like microbes (phytoplankton) that live in the coastal waters. The algae eventually die and sink to deeper layers of the Gulf, where they are decomposed by bacteria. Like human breathing, decomposition uses up oxygen. Under the right conditions, the bottom waters become severely depleted in oxygen, suffocating fish and other marine life that can’t escape.
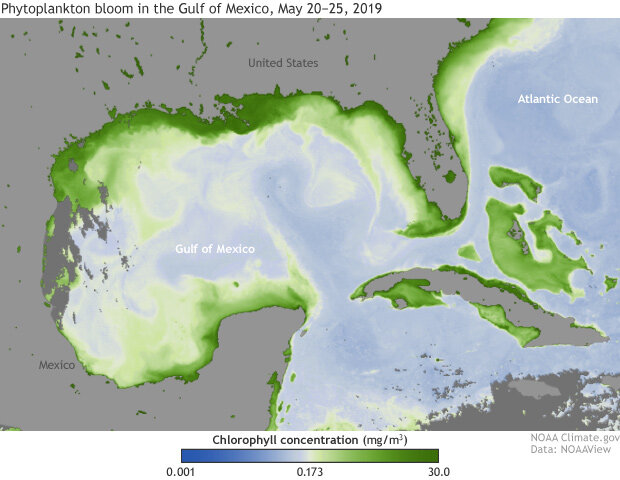
Satellite-based estimates of chlorophyll in the Gulf of Mexico from May 20–25, 2019. An overgrowth of and other plant-like microbes called phytoplankton eventually decay, which uses up oxygen. NOAA Climate.gov image, based on data from NOAA EVL.
The size of the dead zone in any given summer is significantly influenced by spring climate—other things being equal, the wetter the spring, the greater the nutrient pollution, the bigger the algae blooms, and the larger the dead zone. The combined winter and spring (December 2018-May 2019) precipitation in the National Weather Service’s Central region, which covers most of the Missouri and Upper Mississippi River Basins, was the wettest winter–spring period on record according to the Climate at a Glance tool from NOAA’s National Center for Environmental Information.
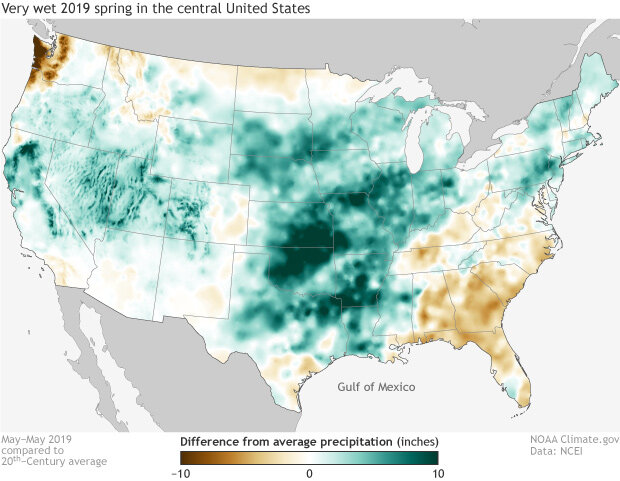
Precipitation in spring 2019 (March-May) was up to 10 inches above the twentieth-century average in parts of the Mississippi River watershed. Climate.gov image based on data from NCEI.
But summer climate and weather events also play a role. As spring changes to summer, the water column in the Gulf becomes very stable, with warm, oxygen-rich water near the surface and colder, saltier, lower-oxygen water below. Under average summer conditions, very little vertical mixing occurs. The only chance for oxygen re-charge in bottom waters is through major wind events, like the passage of a hurricane, that are powerful enough to mix the water column.
The models for forecasting the size of the dead zone assume average climate and mixing conditions for the summer, so the 2019 dead zone could be larger than forecast if the summer is less stormy than average, or smaller than forecast if the Gulf sees more frequent or powerful wind events. (The relatively small size of the dead zone in 2018 was due in part to the passage of three tropical cyclones through the Gulf: Tropical Storms Alberto and Gordon and Hurricane Michael.)
A twentieth-century problem facing twenty-first century challenges
Sediment cores dug up from the ocean floor indicate that a large, yearly dead zone is not a natural phenomenon in the Gulf of Mexico. Microfossils in the sediment layers from the years 1700-1900 include species that cannot tolerate hypoxic (low oxygen) waters, which is a good sign that oxygen stress wasn’t a widespread problem before the twentieth century.
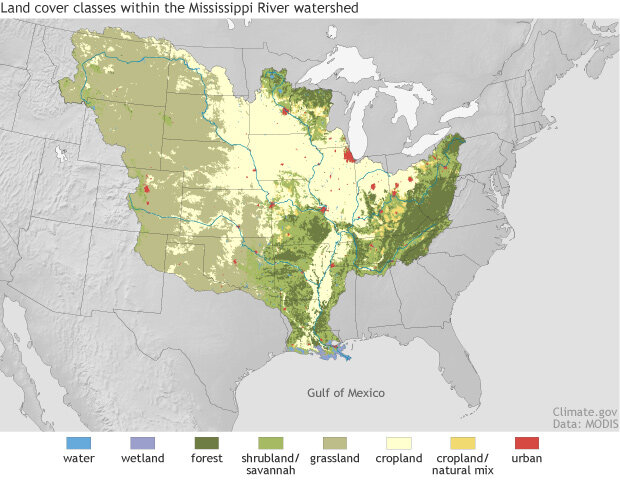
The Mississippi River watershed has been transformed from forests, wetlands, and natural grasslands to farms, cities, and rangeland. Nitrogen and phosphorous pollution in agricultural and urban runoff feeds the annual summer dead zone in the Gulf of Mexico. Climate.gov image based on land cover data from NASA satellites.
The Gulf of Mexico Hypoxia Task Force has set a target for restricting the size of the Gulf of Mexico dead zone to a 5-year average below 5,000 square kilometers (about 1,900 square miles.) Participants in the federal-state-tribal task force have successfully tested a wide range of individual strategies to reduce nutrient pollution, including market-based incentives for wetland restoration, home septic system improvements, cover crops, and better stormwater management.
Basin-wide, efforts to date have had mixed success, according to the task force’s 2017 report to Congress. The average nitrogen pollution levels over the period 2011–2015 were down 21% compared to the 1980–1996 baseline, while phosphorous pollution was up 13%. In addition, the report said, the trends in nitrate should be viewed cautiously, since the numbers were strongly influenced by very low river flows in the Mississippi watershed during the dry years of 2012 and 2014. The dead zone area however, remains stubbornly large, with the five-year average from 2014–2018 at around 6,000 square miles—three times the target size laid out by the task force.
Of equal concern is the fact that the average thickness of the dead zone seems to be increasing. Recent research indicates it is the total volume of low-oxygen water (area times thickness) that has the biggest impact on marine life and fisheries. If the hypoxic zone is very thick, even species able to escape the dead zone are squeezed into “sub-prime real estate”: shallower waters that are too warm for optimal growth or reproduction and where they are more vulnerable to predators—including fishing trawlers, which might have unintended impacts on otherwise sustainable fisheries.
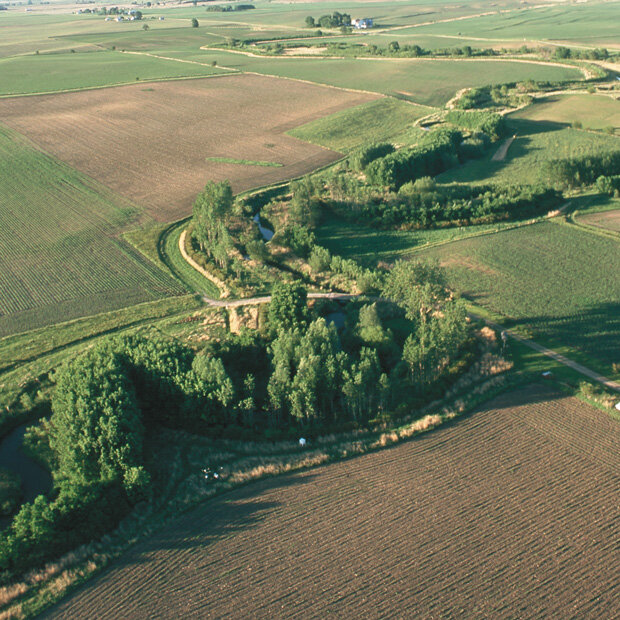
Multiple rows of trees and shrubs, as well as a native grass strip, combine in a riparian buffer to protect Bear Creek in Story County, Iowa. The buffer reduces sediment erosion and the flow of fertilizer-laced runoff into the creek, ultimately benefiting the Gulf of Mexico. Photo taken on June 1, 2000, by Lynn Betts. Provided by the USDA Natural Resources Conservation Service.
If there’s a silver lining to the increasing dead zone thickness problem, however, it’s that models suggest that even modest reductions in nutrient pollution—such as the task force’s intermediate goal of a 20% reduction by 2025—will meaningfully reduce dead zone volume if not area. Reductions in volume may have greater benefits to fisheries and other marine resources than reductions in area.
Human-caused climate change
Adding to the challenge, it’s becoming clear that to get the Gulf dead zone under control, we will also need to take human-caused climate change into consideration. Like a can of soda going flat on a hot day, warming coastal waters will hold less dissolved oxygen. Warming will make the oxygen-rich top waters even more buoyant and harder to mix down. In addition, warming is projected to speed up the pace at which bacteria in the water column break down dead algae and other organic matter, meaning even greater oxygen depletion. Under future climate conditions, the same nutrient pollution levels are likely to make the Gulf dead zone (and others) worse, in terms of size, severity, and duration.
This animated gif shows potential impacts of climate change on the Gulf of Mexico dead zone. Model simulations of baseline oxygen levels in the Gulf of Mexico on July 21–26, 2002, (see observations) compared to projected conditions with global warming of 4°C/7.2°F and a 20% increase in run off. The ‘dead zone’ extent is the area over which dissolved oxygen concentrations fall below 2 milligrams per liter of water. NOAA Climate.gov image, based on data from Justic et al., 2016, provided by Lixia Wang.
In the Gulf of Mexico, changes in precipitation patterns due to global warming may add a final challenge. Heavy precipitation events have increased in all regions of the contiguous United States in the past century, with some of the biggest increases happening in regions that feed the Mississippi watershed. According to the Fourth National Climate Assessment, these trends in extreme rainfall are likely to continue.
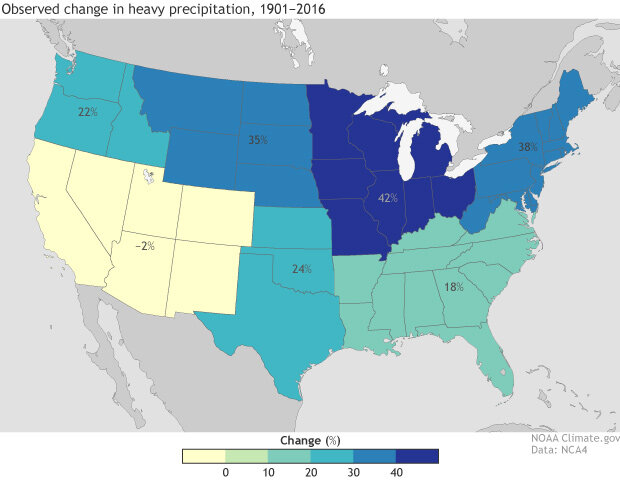
Heavy precipitation has become more intense and more frequent across most of the United States, particularly in the Northeast and Midwest. This map shows the observed change in the amount of precipitation falling in the heaviest 1% of daily events (99th percentile of the distribution) between the start of the historical period (1901–1960) and the end (1986–2016). Climate.gov map adapted from Figure 2.6 in the Fourth National Climate Assessment, based on data provided by Ken Knunkel.
In last week’s press release, Steve Thur, Ph.D., director of NOAA’s National Centers for Coastal Ocean Science, said,
This year's historic and sustained river flows will test the accuracy of [dead zone forecast] models in extreme conditions, which are likely to occur more frequently in the future according to the latest National Climate Assessment. The assessment predicts an increase in the frequency of very heavy precipitation events in the Midwest, Great Plains, and Southeast regions, which would impact nutrient input to the northern Gulf of Mexico and the size of the hypoxic zone.
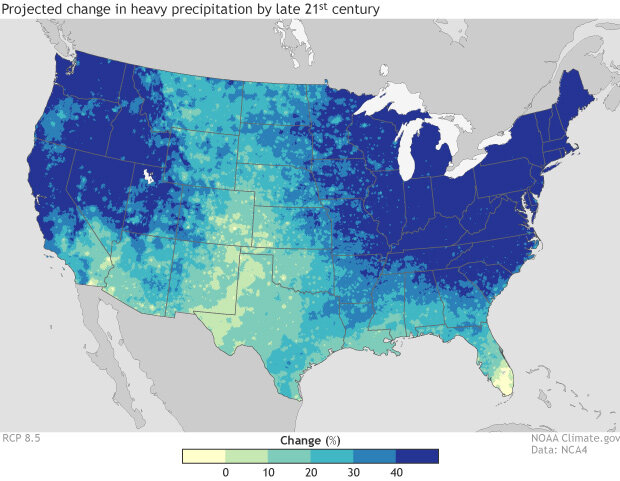
Warming of the climate due to increasing greenhouse gases in the atmosphere is projected to increase the amount of rain that falls in heavy events. This map shows how a future path of higher greenhouse gas emissions (RCP 8.5) is projected to change the total yearly precipitation that falls in the heaviest 1% of daily events from 1901-2016. NOAA Climate.gov map adapted from Figure 2.6 in the Fourth National Climate Assessment, based on data provided by Ken Kunkel.
NOAA continues to assist the Gulf of Mexico dead zone task force efforts by supporting an annual research cruise that maps the size and severity of the dead zone, issuing an annual forecast based on multi-model input and helping to improve those models, and doing research to help advance understanding of the impacts of the dead zone on commercially valuable ecosystems and fisheries in the Gulf.
Links
National Centers for Coastal Ocean Science (National Ocean Service)
Annual maps of dead zone extent based on NOAA-funded research cruises
Gulf of Mexico Nutrient Task Force
References
Altieri, A. H. and Gedan, K. B. (2014), Climate change and dead zones. Global Change Biology, doi: 10.1111/gcb.12754
Hayhoe, K., D.J. Wuebbles, D.R. Easterling, D.W. Fahey, S. Doherty, J. Kossin, W. Sweet, R. Vose, and M. Wehner, 2018: Our Changing Climate. In Impacts, Risks, and Adaptation in the United States: Fourth National Climate Assessment, Volume II [Reidmiller, D.R., C.W. Avery, D.R. Easterling, K.E. Kunkel, K.L.M. Lewis, T.K. Maycock, and B.C. Stewart (eds.)]. U.S. Global Change Research Program, Washington, DC, USA, pp. 72–144. doi: 10.7930/NCA4.2018.CH2
Hypoxia Task Force, Environmental Protection Agency. (2015). Mississippi River/Gulf of Mexico Watershed Nutrient Task Force 2015 Report to Congress. https://www.epa.gov/sites/production/files/2015-10/documents/htf_report_to_congress_final_-_10.1.15.pdf (Accessed June 17, 2019).
Laurent, A., Fennel, K., Ko, D. S., & Lehrter, J. (2018). Climate Change Projected to Exacerbate Impacts of Coastal Eutrophication in the Northern Gulf of Mexico. Journal of Geophysical Research: Oceans, 123(5), 3408–3426. https://doi.org/10.1002/2017JC013583
Obenour, D. R., Scavia, D., Rabalais, N. N., Turner, R. E., & Michalak, A. M. (2013). Retrospective Analysis of Midsummer Hypoxic Area and Volume in the Northern Gulf of Mexico, 1985–2011. Environmental Science & Technology, 47(17), 9808–9815. https://doi.org/10.1021/es400983g
Rabalais, N. N., Turner, R. E., & Wiseman, W. J. (2002). Gulf of Mexico Hypoxia, A.K.A. “The Dead Zone.” Annual Review of Ecology and Systematics, 33(1), 235–263. https://doi.org/10.1146/annurev.ecolsys.33.010802.150513
Scavia, D., Justić, D., Obenour, D. R., Craig, J. K., & Wang, L. (2019). Hypoxic volume is more responsive than hypoxic area to nutrient load reductions in the northern Gulf of Mexico—and it matters to fish and fisheries. Environmental Research Letters, 14(2), 024012. https://doi.org/10.1088/1748-9326/aaf938