2013 Arctic sea ice minimum compared to the new "normal"
The National Snow and Ice Data Center (NSIDC) tracks sea ice extent for both the Arctic and the Antarctic. From 2000 through June 2013, NSIDC compared current ice extents to a baseline, or "normal" period, from 1979-2000. Starting in July 2013, they changed to a 30-year baseline period: 1981-2010.
In most cases, a 30-year period is long enough to average out short-term variability, so adding and dropping new decades to a "normal" has little influence on anomalies or trends. However, because Arctic sea ice extent has declined dramatically in the past decade, the new normal extent is smaller than the old one. That difference means maps and graphs that Climate.gov publishes going forward may look slightly different than ones we have published in the past.
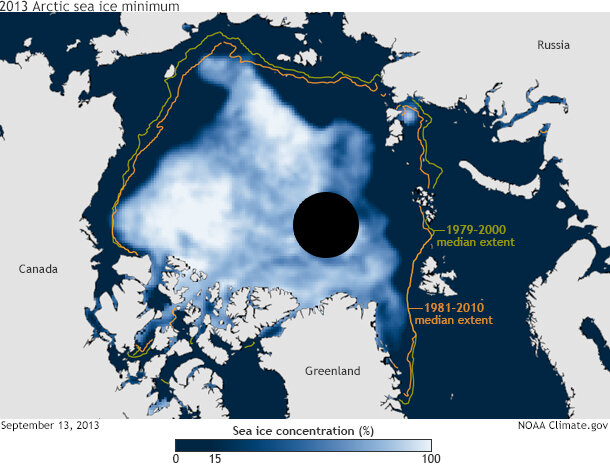
Sea ice concentration on September 13, 2013, compared to the old baseline (1979-2000, green) and the new baseline (1981-2010, orange). The baselines represent the median ice extent (half of the years were larger, half were smaller) for mid-September during the time period. The "normal" extent is smaller than it used to be, especially in the western Arctic. Historically, the North Pole was not well observed by satellites (black hole). Map by NOAA Climate.gov, based on sea ice data analysis by Rockhopper Development Team, NSIDC.
Why change?
Ice experts at NSIDC made the change largely to be consistent with NOAA's climate normals for temperature and precipitation. The baseline change for sea ice only became possible recently. Until a few years ago, NSIDC could not draw from a 30-year baseline because it simply didn't exist; a continuous satellite record of sea ice extent only reaches back to 1979. But as satellite observations accumulated, NSIDC fielded many requests from data users to provide a 30-year baseline period.
NSIDC scientists note the drawback of the change on the organization's Arctic Sea Ice News & Analysis blog:
NOAA@NSIDC makes this change with some concern, however. An average baseline period, or normal, is used as a convenient reference to compare trends and anomalies. If the baseline range includes periods of significant change, the resulting climatology does not necessarily represent "normal" conditions for comparisons. In other words, ideally the baseline period should be relatively stable with small or no trend. This is not the case for sea ice in the Arctic, particularly since 2000.
Since the end of the twentieth century, the frequency of record low sea ice extents has increased, with new records in 2002, 2005, 2007, and 2012. So the new baseline period, which extends through 2010, includes three record lows since the year 2000. The records occurred during a period of sharp overall decline in Arctic sea ice extent. (The same period brought small increases in sea ice extent in Antarctica.)
New versus old
These graphs (adapted from screen grabs from the NSIDC's blog) compare the old baseline period (left) and the new baseline period (right). The baseline average appears as a black line, and a broad gray band delineates two standard deviations for that period—generally considered the range of "normal."
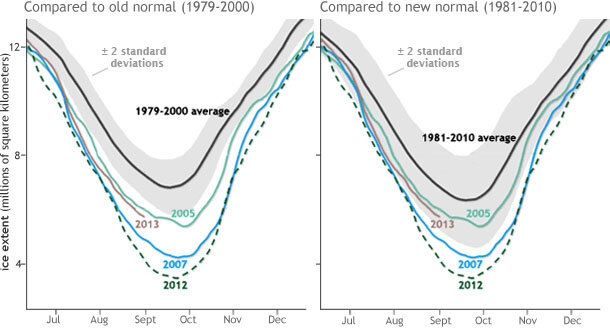
Sea ice extent graphs showing recent years compared to the 1979-2000 average (left) and 1981-2010 (right). Some years (2005, 2013) that would have been "out of bounds" for the old normal now appear in the normal range (gray shading). Graphs adapted by Climate.gov from originals on the National Snow and Ice Data Center Website.
Superimposed on the old and new baseline periods are extent lines for 2005 (bright green), 2007 (bright blue), 2012 (dashed dark green), and 2013 (brown). The baseline period change means that some years, e.g., 2005 and 2013, have summertime extents that fall largely outside the bounds of normal for the previous baseline period, but inside the bounds of normal for the new baseline period. In fact, summertime Arctic sea ice extents for most of the last decade fell outside the 1979-2000 baseline period, but only the extents for 2007, 2011, and 2012 fell outside the new normal. In short, the new normal is abnormal.
You can compare old and new baselines and summertime sea ice extents for 1979 through 2013 through Charctic on the NSIDC site. Although a continuous satellite record for Arctic sea ice only reaches back to 1979, sea ice scientists can draw on other data sets for sea ice extent prior to that year, including sea ice charts and other sources.
References
National Climatic Data Center. (2011, January 5). NOAA's 1981-2010 Climate Normals. Accessed July 9, 2013.
National Snow and Ice Data Center. (2013, July 1). Baseline Period Change. Accessed August 27, 2013.