2013 State of the climate: Mountain glaciers
Why it matters
Around the globe, some 370 million people live in basins where rivers derive at least 10 percent of their seasonal discharge from glacier melt. Glacier melt provides drinking water for human populations, and irrigation water for crops. Dams on glacier-fed rivers are key sources of hydroelectric power in some parts of the world. The retreat of the majority of mountain glaciers worldwide is one of the clearest signs that climate is warming over the long term; some glaciers have already disappeared.
Conditions in 2012/2013
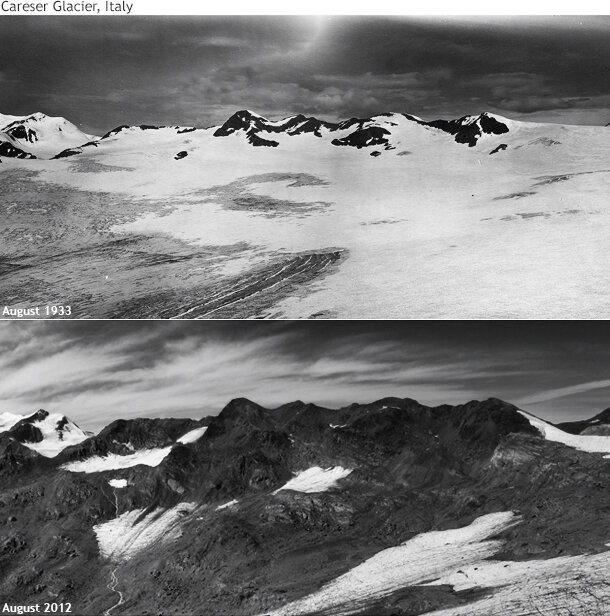
Photos documenting the disintegration of Italy’s Careser Glacier between 1933 (top) and 2012 (bottom). After decades of negative mass balance, glaciers worldwide are shrinking, fragmenting, or disappearing. Photos courtesy of Luca Carturan, University of Padova.
In 2012—for the 23rd consecutive year—mountain glaciers worldwide lost more mass through melting than they gained through new snow accumulation. The net mass loss was equivalent to just over 2 feet of water. Observations for 2013 for all 30 historically monitored “reference glaciers” are still being analyzed, but based on data from Austria, Canada, Nepal, New Zealand, Norway, and the United States, it’s highly likely that 2013 will become the 24th year with an average negative glacier mass balance.
| Region | Status as of 2013 |
| Austria (the Alps) | 93 retreating, 1 advancing, 2 stable |
| Norway | 26 retreating, 3 advancing, 4 stable |
| North Cascades (WA), Alaska | all 14 glaciers had significantly negative mass balance |
| New Zealand | altitude of the end-of-summer snow line for all 50 observed glaciers was farther up the mountain than would be required for the glaciers to grow |
| Nepal | 3 glaciers near equilibrium, accumulation the highest of last 7 years |
Preliminary data available for reference glaciers in 2013.
Change over time
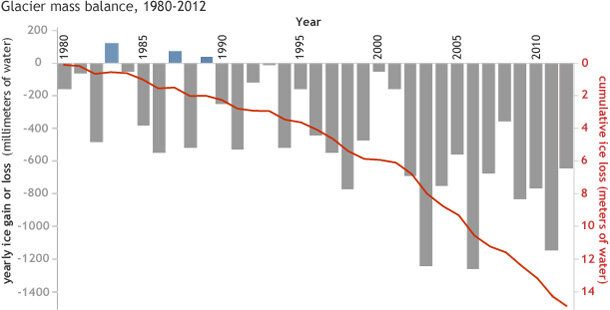
Annual gains (blue bars) and losses (gray bars) for 30 reference glaciers from 1980-2012. The red line shows cumulative ice loss. Cumulative losses through 2012 are close to 15 meters (50 feet) water equivalent. Graph adapted from Figure 2.10 in State of the Climate in 2013.
Based only on the 30 climate-reference glaciers tracked by the World Glacier Monitoring Service (glaciers with the longest, most reliable records), mountain glaciers have lost the equivalent of 50 feet (15.1 meters) of water since 1980. Considering all glaciers for which we have at least some records, mountain glaciers and ice caps have lost an amount of ice equivalent to slicing a 54-foot-thick slab (16.5 meters) off the top of an average glacier, and the rate of loss has accelerated in each of the past three decades. From the 1980s, to the 1990s, to the 2000s, the mass balance deficits grew from -7.8 inches, to -15 inches, to -29 inches water equivalent ( -198, -382, -704 mm, respectively).
References & Resources
Pelto, M.: 2014 [Global Climate] Cryosphere: Alpine Glaciers and Ice Sheets [in “State of the Climate in 2013]. Bulletin of the American Meteorological Society, 95(7), S 18-19.
Carturan, L., Baroni, C., Becker, M., Bellin, A., Cainelli, O., Carton, A., ... & Seppi, R. (2013). Decay of a long-term monitored glacier: the Careser glacier (Ortles-Cevedale, European Alps). The Cryosphere, 7(6), 1819-1838.
Pelto, M. S. (2010). Forecasting temperate alpine glacier survival from accumulation zone observations. The Cryosphere, 4, 67-75, doi:10.5194/tc-4-67-2010.
World Glacier Monitoring Service. Glacier Mass Balance Bulletins.