Climate Change: Arctic sea ice summer minimum
The Arctic Ocean occupies about 6 million square miles around Earth's North Pole. Historically, most of the surface of the Arctic Ocean remained ice-covered year round. Around this core of year-round ice was a fringe of seasonal ice that froze each winter and melted each summer. The Arctic ice pack reaches its maximum extent in March, and its minimum extent in September.
In September 2022, the area that was at least 15 percent ice covered was 4.87 million square kilometers (1.88 million square miles), tying with 2010 for eleventh lowest in the satellite record. That's 1.54 million square kilometers (595,000 square miles) smaller than the 1981-2010 average—an area larger than Alaska. The smallest daily extent occurred on September 18, when the total ice extent bottomed out for the summer at 4.67 million square kilometers (1.8 million square miles).
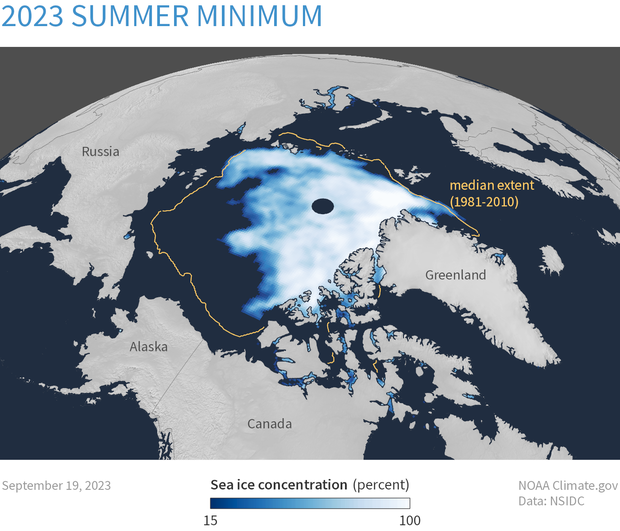
Arctic sea ice extent for September 19 2023, was 4.23 million square kilometers (1.63 million square miles). It was the sixth smallest summer minimum on record. The orange line shows the 1981 to 2010 average extent for that day. NOAA Climate.gov image, based on data from the National Snow and Ice Data Center.
According to the National Snow and Ice Data Center, the amount of ice that survives the summer melt season has shrunk by 13 percent per decade relative to the 1981–2010 average. In the 2020 Arctic Report Card, experts reported that the average minimum extent for each third of the satellite record has successively declined: 6.85 million square kilometers (2.64 million square miles) for 1979-1992, 6.13 million square kilometers (2.37 million square miles) for 1993-2006, and 4.44 million square kilometers (1.71 million square miles) for 2007-2020.
How sea ice freezes, melts, and moves
Just as ponds and lakes in northern states develop a layer of ice on their surfaces during cold winters, the surface of the Arctic Ocean also freezes, forming sea ice. Seawater has a lower freezing point than fresh water, but once it is chilled to around -2°C (about 28°F), the salty liquid begins to solidify. Ice crystals appear on the sea surface, and if the air is cold enough, the crystals expand to form a slushy mix, then a solid covering of ice that can thicken over time.
In the Arctic Ocean, the area covered by sea ice grows and shrinks over the course of the year. Each fall, as less sunlight reaches the Arctic and air temperatures begin to drop, additional sea ice forms. The total area covered by ice increases through the winter, usually reaching its maximum extent in early March. Once spring arrives, bringing more sunlight and higher temperatures, the ice begins to melt back, shrinking to its minimum extent each September. Sea ice minimum and maximum extents occur toward the end of summer and the end of winter in part because the ocean lags behind the atmosphere in warming up and cooling down.
Sea ice that hasn't yet survived a summer melt season is first-year ice. This thin, new ice is vulnerable to melt and disintegration in stormy conditions. Ice that survives a summer melt season can grow thicker and less salty—two things that make it more resistant to melt. Multiyear ice is more likely to survive temperatures that would melt first-year ice, and to survive waves and winds that would break up first-year ice. Although sea ice moves more slowly than ocean water, ice still moves. Carried by ocean currents, Arctic sea ice regularly flows out toward the warmer waters in the Atlantic via the Fram Strait east of Greenland.
Long-term changes in Arctic sea ice
Scientists use climate proxies like sediment/ice cores, tree rings, and fossilized shells of ocean creatures to infer sea ice extent far back in time. These paleoclimate records show that while there have been several periods over the past 1,450 years when sea ice extents expanded and contracted, the decrease during the modern era is unrivaled. In the 2017 issue of NOAA’s Arctic Report Card, scientists reported that today's low extent is far lower than anything that's occurred over at least the past 1,500 years. Not only that, but it is well outside the range of natural variability during that period.
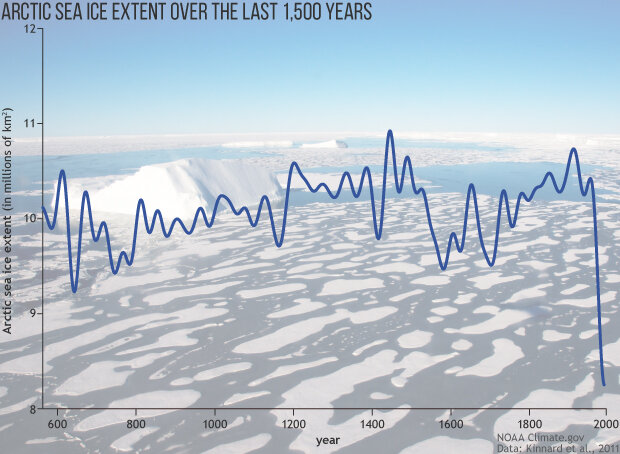
This time series shows the Arctic sea ice extent in millions of square kilometers over the past roughly 1,500 years. The vertical axis starts at 8, not 0, to better show year-to-year variations. Taken from the 2017 issue of NOAA’s Arctic Report Card, scientists report on a body of paleoclimate research that shows that the extent and rate of sea ice decline in the Arctic is unprecedented over at least the past 1,500 years. Climate.gov image adapted from Figure 3 in “Paleoceanographic Perspectives on Arctic Ocean Change” in the 2017 Arctic Report Card. Original data from Kinnard et al., 2011.
Early observations of sea ice coverage in the Arctic come to us both from the oral histories of native populations and from the records of early European mariners who were seeking a "Northwest Passage" to the lucrative markets in Asia. Records of sea ice near the coast of Iceland data back to the 9th century, and records became more routine in the 17th century. British and Russian records of sea ice conditions along sailing routes became routine in the 18th and 19th centuries. Detailed shipping charts, available from the United Kingdom Met Office Hadley Centre, show that Arctic sea ice has declined at least since the mid-1950s.
Satellite data have documented continued declines; since continuous satellite-based measurements began in November 1978, data show a trend of more ice melting away during summers and less new ice forming during winters. The Beaufort Gyre, a looping current north of Alaska, historically acted as a nursery for young ice, enabling it to thicken and grow. Ice growth in the Beaufort Gyre roughly offset the flow of ice out of the Arctic via the Fram Strait. Since the start of the 20th century, however, summers in the southern portion of the gyre have been too warm for sea ice to survive.
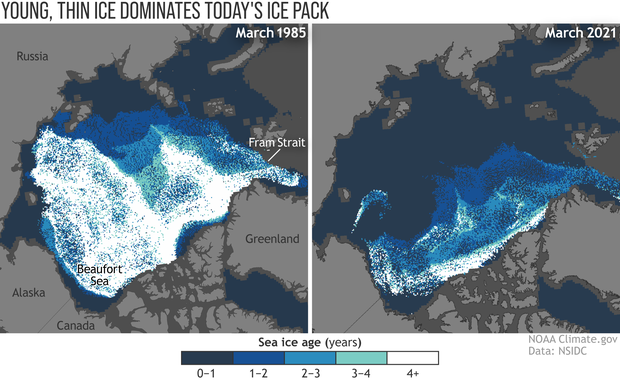
Routine observations of Arctic sea ice thickness only began about a decade ago, experts use the age of the ice pack—which has been observed since the 1980s—as a proxy for ice thickness. In mid-March 1985 (left), the winter maximum ice pack was dominated by ice at least 4 years old (white). In 2021 (right), only a small strip of very old ice remained tucked up against the islands of the Canadian Arctic. More than half of the winter ice pack was less than a year old (dark blue). NOAA Climate.gov image, based on data from the National Snow and Ice Data Center.
These changes in ice survival mean that even though the sea ice extent at the winter maximum in March has declined more slowly than the extent at summer minimum (2.6 percent per decade in March versus 13 percent per decade in September), the winter ice pack is fundamentally different than it once was. Near the start of the satellite era in the mid-1980s, as much as one-third of the ice cover was made up of thick, multi-year ice. In 2020, it was 5 percent.
Percent difference from average sea ice extent in the Arctic at each year's summer minimum in September (bright blue) and winter maximum in March (dark blue) from 1979–2022. Sea ice is declining 5 times more quickly in summer than it is in winter. NOAA Climate.gov image, adapted from Figure 1 in 2022 Arctic Report Card: Sea Ice.
Having so much of the winter ice cover made up of thin, first year ice creates a feedback loop in which the ice is less likely to survive in the summer. It makes the ice pack particularly vulnerable to big, single-year drops during exceptionally warm or stormy summers, drops that the ice pack is unlikely to recover from in the current climate. In addition, the thin ice is more dangerous for native Arctic people who still practice their traditional way of life, which depends on reliably thick ice for hunting and fishing activities. In coastal communities, thin ice also provides far less protection than thick ice from the pounding surf that accompanies fall and winter storms.
Arctic amplification: a not-so-positive feedback
Arctic sea ice declines are related to the phenomenon known as Arctic amplification: more intense warming in the Arctic than over the rest of the globe. Arctic amplification fits with current scientific understanding of Earth's climate system, and with model projections of global warming caused by greenhouse gas emissions. Multiple factors contribute to Arctic amplification, and sea ice loss is one of them.
Sea ice's white or light gray surface reflects up to 80 percent of incoming sunlight, deflecting additional energy away from the planet. With less ice present, the dark surface of ocean water absorbs considerably more sunlight energy, leading to further warming of the sea surface and overlying atmosphere, which leads to more melting of ice, which leads to more warming, and so on. Scientists are actively studying the effects of this feedback loop to help them understand and predict how decreases in Arctic sea ice and snow cover will affect the global climate system.
Impacts of sea ice loss
In the early 20th century, explorer Roald Amundsen took three years (1903–1906) to traverse the Northwest Passage, a route that would allow ships to travel between the Atlantic and Pacific Oceans through the western Arctic. Although it's not yet a dependable pathway for commercial ships, the Northwest Passage has experienced relatively ice-free conditions multiple times since the turn of the 21st century, drawing tourists. Meanwhile, the Northern Sea Route along the coast of Siberia has experienced more consistent ice-free conditions in the summer, which may soon transform it into a reliable shipping route.
The opening of shipping lanes across the Arctic may provide shippers with viable alternatives to traveling through the Panama Canal or around the southern tip of South America. This new reality will have impacts not only on the environment, but also on the world economy and national security, as nations compete to gain rights to shipping lanes and newly accessible resources in the Arctic.
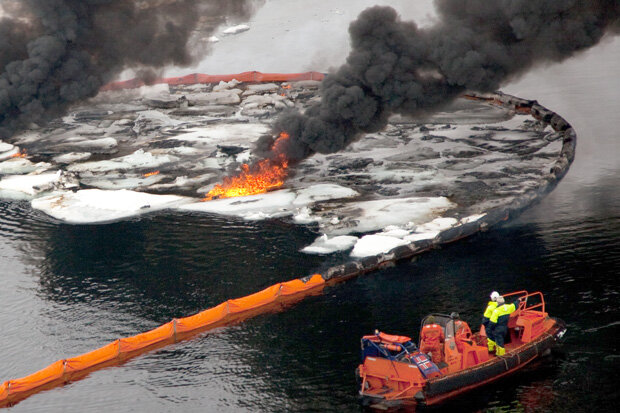
Responding to oil spills in the ice-covered Arctic Ocean would pose unique challenges. For example, floating booms often used to concentrate oil for burning—as in this field experiment in the Barents Sea—must be strong enough to handle increased drag from ice floes. Photo courtesy SINTEF.
Loss of sea ice means lost habitat for marine mammals like polar bears, walruses, and seals, along with disruptions to the food supply of Arctic communities who depend on them. A longer ice-free season exposes Arctic communities to extreme erosion from pounding waves during winter storms. Loss of reflective sea ice and the associated ocean warming are also changing the abundance and range of commercially important high latitude fish species. In addition, in the 2021 Arctic Report Card, scientists reported on two new disturbances related to an increasingly long ice-free season: more underwater noise and more trash from fishing vessels.
Further Reading
Arctic Meltdown, Economic and Security Implications of Global Warming. Foreign Affairs, Scott G. Borgerson. Accessed March 17, 2009.
References
All About Sea Ice, National Snow and Ice Data Center. Accessed March 17, 2009.
State of the Cryosphere: Sea Ice, National Snow and Ice Data Center. Accessed January 11, 2017.
Arctic Sea Ice News and Analysis, National Snow and Ice Data Center. Accessed September 26, 2019.
Intergovernmental Panel on Climate Change. (2013). Climate Change 2013: The Physical Science Basis Summary for Policymakers. Contribution of Working Group I to the Fifth Assessment Report of the Intergovernmental Panel on Climate Change.
Data
September Sea Ice Extent, National Snow and Ice Data Center.