State of the Climate: 2011 Ocean Heat Content
With its large heat capacity and tremendous volume, the global ocean has vastly more potential to store heat than the atmosphere or the land surfaces. The top two meters of ocean water contain about as much heat as the entire column of atmosphere above them. The ocean’s tremendous ability to store and release heat over long periods of time gives the ocean a central role in stabilizing Earth’s climate system.
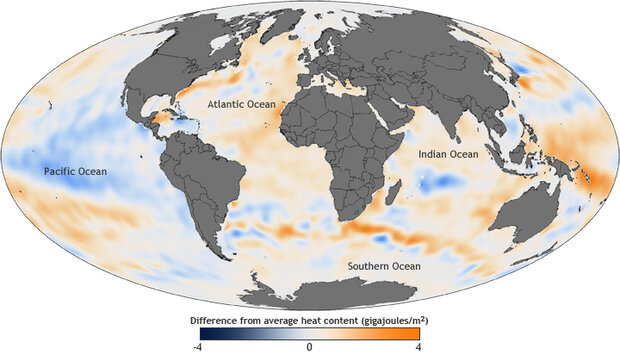
The colors on the map above show how much heat the top 2,300 feet (700 meters) of the ocean contained in 2011 compared to the average from 1955 to 2006. Orange and blue areas show where the upper ocean’s heat storage rose or fell compared to its average value by as much as 4 gigajoules per square meter — that’s enough energy in one square meter alone to power a 100-watt light bulb continuously for nearly a year. NOAA map by Dan Pisut, Environmental Visualization Lab, based on heat content data from the National Ocean Data Center.
The colors on the map above show how much heat the top 2,300 feet (700 meters) of the ocean contained in 2011 compared to the average from 1955 to 2006. Orange and blue areas show where the upper ocean’s heat storage rose or fell compared to its average value by as much as 4 gigajoules per square meter — that’s enough energy in one square meter alone to power a 100-watt light bulb continuously for nearly a year. An arrowhead-shaped swath of blue extends out from the equator in the eastern Pacific, reflecting La Niña conditions that persisted throughout most of the year.
But with the exception of La Niña, and a few other locally cool spots, the upper ocean held more heat than average in 2011 in most of the four major oceans visible on the map. Climate scientists have linked this excess heat to an imbalance in Earth’s energy budget—the amount of incoming sunlight the Earth absorbs minus the amount it radiates back into the frigid emptiness of space as heat.

The graph shows one analysis of ocean heat content anomalies since 1993, with gray shading to indicate the range of uncertainty. Graph adapted from Figure 3.8 in the BAMS’ State of the Climate in 2011.
Increasing concentrations of greenhouse gases are preventing heat from escaping into space as freely as it used to, and most of the excess heat is being stored in the upper ocean. The graph above shows one analysis of ocean heat content anomalies since 1993, with gray shading to indicate the range of uncertainty. (Two other analyses, showing similar patterns, are included in the State of the Climate in 2011.) Ocean heat content anomalies reached a new high in 2011, but they have been increasing more slowly since around 2003 than they did in the previous decade.
NOAA map by Dan Pisut, Environmental Visualization Lab, based on heat content data from the National Ocean Data Center. Graph adapted from Figure 3.8 in the BAMS’ State of the Climate in 2011. Caption by Rebecca Lindsey and Caitlyn Kennedy. Reviewed by Jessica Blunden and Deke Arndt, National Climatic Data Center.
Reference
Johnson, G.C., J. M. Lyman, J. K. Willis, S. Levitus, T. Boyer, J. Antonov, and S. A. Good, 2012: [Global oceans] Ocean heat content [in “State of the Climate in 2011”]. Bull. Amer. Meteor. Soc., 93 (7), S62–S65.
![]()