State of the Climate: 2011 Sea Surface Temperature
The oceans are Earth’s biggest storage bin for heat. While heat is stored and mixed throughout the depth of the ocean over decades to centuries, it is the temperature at the surface that plays a significant role in seasonal and yearly variation in climate. Sea surface temperature also has a major impact on ocean life, including coral reef health, and populations of phytoplankton, which are the base of the whole ocean food web.
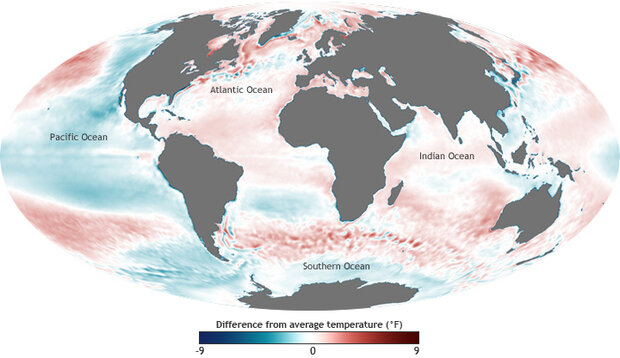
The map shows sea surface temperature during 2011, compared to the long-term average from 1981 to 2010. Places that were up to 9 degrees Fahrenheit colder than the 1981-2010 average are dark blue, near-average temperatures are white, and places where temperatures were up to 9 degrees F warmer than average are red. NOAA map by Dan Pisut, Environmental Visualization Lab, based on “optimal interpolation” sea surface temperature data from the National Climatic Data Center.
The map above shows sea surface temperature during 2011, compared to the long-term average from 1981 to 2010. The evidence of the year’s double-dip La Niña event is revealed by a ribbon of blue (cooler-than-average temperatures) that stretched from the west coast of South America through the center of the Pacific.
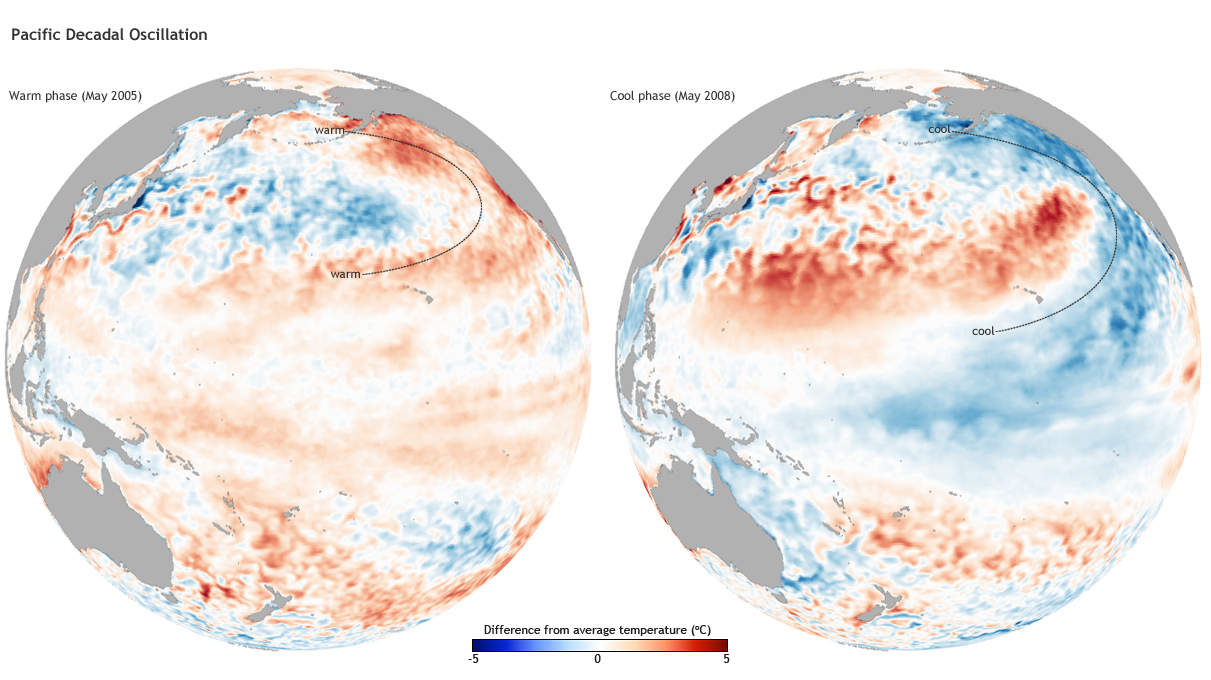
The cool tropical waters brought by La Niña mingled with a larger pattern affecting most of Pacific north of the equator–the Pacific Decadal Oscillation, which was in its cool phase in 2011. The Pacific Decadal Oscillation describes periodic shifts in ocean temperatures that occur over the span of years to decades. The classic “signal” of the cool phase is a horseshoe of cool water in the eastern North Pacific that surrounds a pocket of warm water in the central North Pacific.
In 2011, La Niña cooled the tropical Pacific Ocean, but warmer-than-usual temperatures continued to dominate the remainder of the global ocean. Outside of the Pacific Ocean, warmer-than-average temperatures occurred in the western and southern Indian Ocean and the North Atlantic.
Natural patterns such as La Niña and the Pacific Decadal Oscillation, which influence the climate on a year-to-year or decade-to-decade basis, occur against a backdrop of warming that has been occurring over the longer term.
The blue line in the graph shows how far above or below the 1981-2010 average (dashed line at zero) the sea surface temperature has been each year since 1950. The data shown are one of several ocean temperature records included in State of the Climate in 2011, each of which shows similar anomalies. Graph is adapted from Figure 3.5 in the BAMS’State of the Climate in 2011.
The temperature at the surface of the ocean has been rising over time. The blue line in the graph above shows how far above or below the 1981-2010 average (dashed line at zero) the sea surface temperature has been each year since 1950. The data shown are one of several ocean temperature records included in State of the Climate in 2011, each of which shows similar anomalies. Each year in the past decade, the sea surface temperature has been warmer than the 1981-2010 average, an indicator of long-term climate change.
NOAA map by Dan Pisut, Environmental Visualization Lab, based on “optimal interpolation” sea surface temperature data from the National Climatic Data Center. Graph is adapted from Figure 3.5 in the BAMS’ State of the Climate in 2011. Caption by Caitlyn Kennedy. Reviewed by Jessica Blunden and Deke Arndt, National Climatic Data Center.
Reference
Xue, Y., Z. Hu, A. Kumar, V. Banzon, T. M. Smith, and N. A. Rayner, 2012: [Global oceans] Sea surface temperatures [in “State of the Climate in 2011”]. Bull. Amer. Meteor. Soc., 93 (7), S58–S62.
![]()