U.S. climate outlook for October 2024
Other than copious amounts of rainfall associated with Hurricane Helene in the Southeast, September was generally another dry month across much of the nation. As such, drought across the country increased again last month. Temperatures during September were mixed with much above-normal temperatures across the Northern Plains, but normal to even below-normal temperatures across parts of the Southeast and Eastern U.S.
With over 70% of the nation at least abnormally dry, will October be another drier-than-normal month, adding to further expansion of drought? And as we head closer to winter, will the mild temperatures of September continue? Let’s see what NOAA’s Climate Prediction Center (CPC) predicts for October.
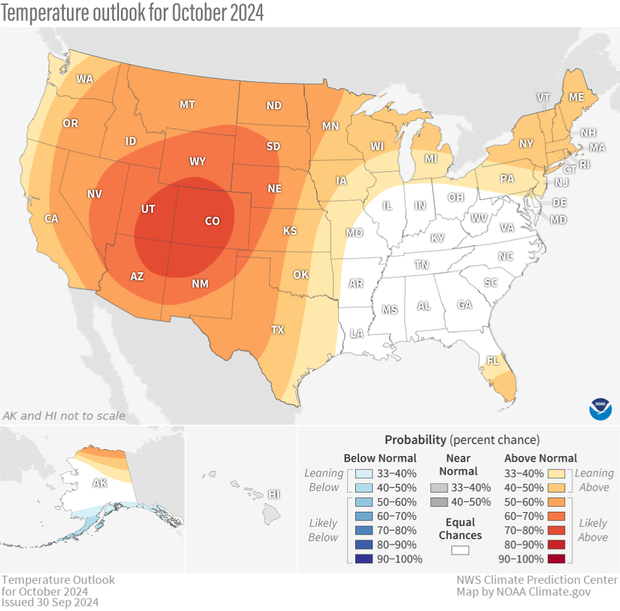
The U.S. temperature outlook for October 2024, showing where the monthly temperature is favored to be much warmer than average (orange and red) for October or much cooler than average (blues). Darker colors mean higher chances, not more extreme temperatures. White areas mean that there are equal chances for a warm, cool, or near-average October. Much warmer or much cooler than average means "in the upper or lower third" of average October temperatures from 1991-2020. Text-only forecast for Hawaii available from NOAA Climate Prediction Center.
On September 30, CPC released its updated monthly climate outlooks for temperature, precipitation, and drought across the United States for October 2024. The temperature outlook favors well above average temperatures across the central and western parts of the nation, as well as around the Great Lakes and Northeast. The precipitation outlook favors well below average precipitation across much of the central and western parts of the country, with above-average precipitation only favored along the South Atlantic Coast and in Florida.
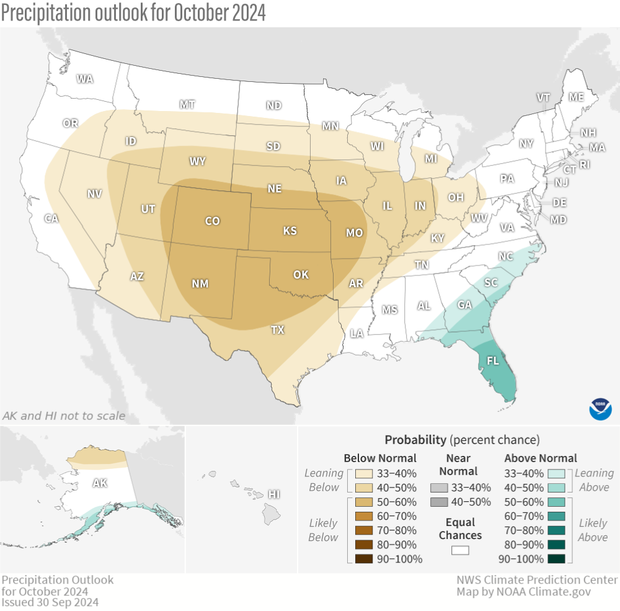
The precipitation outlook for October 2024, showing where the average precipitation (rain and snow) is favored to be much higher than average (greens) or much lower than average (browns). Darker colors mean higher chances, not more extreme precipitation departures. White areas mean that there are equal chances for a wet, dry, or near-average October. Much higher or much lower than average means "in the upper or lower third" of total October precipitation amounts from 1991-2020. Text-only forecast for Hawaii available from NOAA Climate Prediction Center.
I’ll also provide more specifics about the outlooks and their basis, as well as discuss the current state of drought, changes in drought observed during September, and the drought outlook for October. Finally, remember that the colors on the temperature and precipitation outlook maps only provide information about the most likely outcome, and that other outcomes are always possible, just less likely. More details about interpreting the outlooks can be found here.
The updated outlooks were produced considering the Week 1 forecast from the Weather Prediction Center (WPC), and CPC’s own 6-10 day, Week 2, and Week 3-4 outlooks. Other tools that forecasters examined this month were longer-range forecast models such as the Global Ensemble Forecast System (GEFS), the Climate Forecast System (CFSv2), and the European Ensemble Forecast System (ECMWF) as well as products derived from these models. Since we’re still waiting for the arrival of La Niña, it did not play a role in the October outlooks. And while the Madden-Julian Oscillation (MJO) has been active recently the current response in the mid-latitudes has not been consistent with the overwhelming majority of the medium and extended range guidance, so it did not play a significant role in the outlooks.
Temperature outlook favors continued heat in the Western and Central U.S.
The October temperature outlook favors well above average temperatures across all of the central and western parts of the nation, in northern Alaska, in southern Florida, around the Great Lakes, and in the Northeast. (Well above average means “in the warmest third of all Octobers in the recent climate record.”) Equal chance odds (chance of below-, near-, and above-average) were found in the remainder of the country.
The best odds for a warmer-than-average October are centered over the Four Corners region, where probabilities exceed 70%. Almost all of the western and west-central parts of the nation have probabilities exceeding 50%, as temperatures are favored to be above-average in all CPC outlooks for much of this region (6-10 day, Week-2, and Week 3-4). And October is already forecast to begin warm with temperatures expected to be more than 10°F above average, according to forecasts by the WPC. Forecast ridging (jet stream shifted north of normal) is consistently forecast during all time scales for the western part of the nation, consistent with the outlooks. Throughout the Southeast and Ohio and Tennessee Valleys, weak troughing (jet stream shifted south of normal) in response to the western ridging introduces a high degree of uncertainty. The CPC mid-range guidance favors near-average temperatures and the longer-range guidance (Week 3-4) has an equal chance forecast.
Precipitation outlook again tilts dry
The precipitation outlook for October favors below-average rainfall across large parts of the country, with the largest odds (greater than 50%) found in the southern and central Plains. The aforementioned predicted ridging over the West supports the large area favored to have another drier-than-average month. Below-normal rainfall is also favored in the short-, medium-, and longer-range outlooks. Above-average rainfall is only favored for southern Alaska and the extreme Southeast including Florida, where the month is expected to begin quite wet. All of CPC’s outlooks (6-10 day, Week-2, and Week 3-4) also have some tilt in the odds toward wetter-than-average conditions here.
U.S. Drought area continues to increase during September
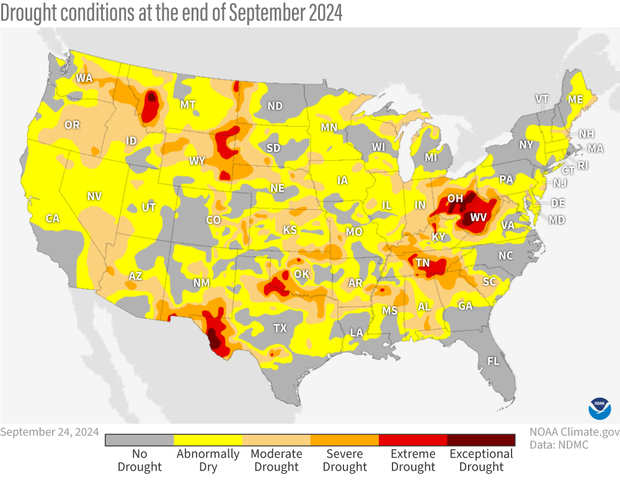
Drought conditions across the contiguous United States as of September 24, 2024. Pockets of extreme (red) and exceptional (dark red) drought were present in Montana, Wyoming, New Mexico, Texas, Oklahoma, Tennessee, Ohio, and West Virginia. A fairly large area of the lower 48 was at least abnormally dry (yellow). This map was produced prior to the arrival of extreme rainfall associated with Hurricane Helene across the Southeast at the end of September. Map by NOAA Climate.gov, based on data provided by the U.S. Drought Monitor project.
With another mostly dry month in the books, the amount of drought across the continuous United States continued to increase during September. Drought increased from almost 28% at the beginning of the month to over 34% at the end with another 38% of the nation classified as abnormally dry, potentially setting the state for further drought development. The percent of the country in the two most intense categories (D3-D4, representing extreme and exceptional drought) also increased during the month to just over 3%, although that continues to remain fairly low by historical standards.
Regionally, most of the significant increase in drought was concentrated in the Ohio and Tennessee Valleys, with much of this region recording 2-3 class changes. The drought monitor shown here was finalized prior to the rainfall from Hurricane Helene, so improvements in these regions will appear in the next Drought Monitor. Mainly 1 class degradation was observed over parts of the West, the southern, central and northern Plains (up to 2 class changes), and in the Northeast. In contrast, some drought improvement was observed in parts of the Northwest and across parts of the South, with the largest improvement occurring in central Texas (2-3 classes, with some removal).
Drought outlook predicts persistence and development, with improvement in the Southeast due to Helene
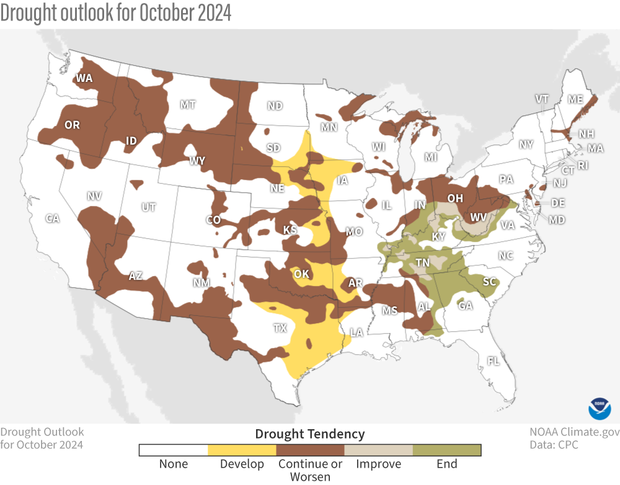
U.S. map of predicted drought changes or persistence in October 2024. Several new areas of drought are likely to develop (yellow) across the central states. Existing drought in those areas and in portions of the West, and Ohio Valley are likely to continue or worsen (brown). Existing drought in the Central and Southern Appalachians is expected to improve by at least 1 category (tan) or end (green). NOAA Climate.gov map, based on data from the Climate Prediction Center (CPC). See CPC version for Alaska and Hawaii.
Drought persistence during October is likely for large parts of the central and western U.S., with above-average temperatures and below-average rainfall favored for most of these regions. Drought development is also predicted across parts of the Plains, mainly in regions with significant 90-day precipitation deficits and declining soil moisture. Although the precipitation outlook also depicts increased odds for below-normal rainfall out West, no large-scale development is anticipated since drought development tends to be slower in this region, during what is typically a dry month.
In contrast, heavy to excessive rainfall associated with Hurricane Helene and its remnants will lead to drought improvement or removal across parts of the Southeast and in the Tennessee and Ohio Valleys. However, drought is predicted to persist in the northern part of the Ohio Valley, as rainfall amounts from Helene’s remnants were less than 2 inches and October is slightly favored to be drier-than-average.
To read the entire discussion of the monthly climate outlooks from the Climate Prediction Center, check out their website.