In Watching for El Niño and La Niña, NOAA Adapts to Global Warming
No single climate phenomenon has more influence on year-to-year variation in average global temperature than the El Niño-Southern Oscillation (ENSO). When the central tropical Pacific Ocean is warmer than average (El Niño) or colder than average (La Niña), a cascade of atmospheric changes ensures that many parts of the globe feel the effects.
But here’s a problem to consider: if the ocean today is warmer than the long-term average, won’t it look like the tropical Pacific is in a permanent El Niño? Won’t La Niña—the cool phase—just disappear? Will we have to redefine the nature of these influential climate events?
It’s a problem that scientists at NOAA’s Climate Prediction Center, the branch of the agency responsible for monitoring and forecasting ENSO events, have been considering for many years. The solution they came up with doesn’t change the definition of El Niño and La Niña episodes, but they were forced to reconsider what counts as “average” temperature in the tropical Pacific.
Defining El Niño and La Niña
The ENSO-related temperature fluctuations in the tropical Pacific that have such far-reaching impacts on seasonal climates downstream aren’t about a specific temperature. Instead, they are about relative temperatures, one region being hotter or colder than usual, and the climate chaos that ensues when things aren’t “normal.”
NOAA’s operational definition of El Niño and La Niña conditions is pretty basic: seasonal temperatures of 0.5°C warmer (El Niño) or cooler (La Niña) than average in the central tropical Pacific. A “season” is any rolling 3-month average: December-January-February, January-February-March, and so on. The Climate Prediction Center keeps an online record of all the seasonal temperature anomalies back to 1950.
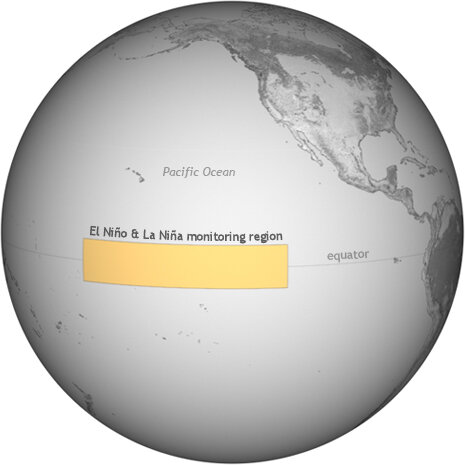
For real-time La Niña/El Niño tracking, NOAA watches for temperature anomalies in the central tropical Pacific (between 5° north and south latitude and 120° to 170° west longitude). Map by Climate.gov team, adapted from original by the NOAA Climate Prediction Center.
For La Niña or El Niño conditions to graduate to a full-blown episode, the temperature anomaly must last five consecutive, overlapping seasons. To allow rankings and comparisons of all historic ENSO events, these long-lived events are color-coded in the Climate Prediction Center’s online table: blue for La Niña, red for El Niño.
Since ENSO events are identified by temperatures that are warmer or cooler than average, the key question is: what’s average? Up until last year, Climate Prediction Center scientists used a 30-year average of the three most recent complete decades, updated in each new decade. So, in the 1990s, for example, they used the 1961-1990 average, and in the 2000s, they used the 1971-2000 average.
Whenever the time period for the average shifted, all the previous seasonal averages in the table of historic events were re-calculated using the new base period. The routine update was supposed to ensure that at any point in time, the relative strength of all El Niño and La Niña episodes identified in the table was consistent—a consistency that is important for research into the influence of these episodes on global and regional climate.
If the climate weren’t changing, the differences between any 30-year average would be very small, and the impacts on the apparent strength of historic El Niño and La Niña episodes would be negligible. But over the span of the past century, ocean temperatures have been getting warmer, which means that the baseline for detecting El Niño and La Niña has been shifting. (For the statistical nitty gritty, see the research article by L’Heureux, et al., at the bottom of the page.)
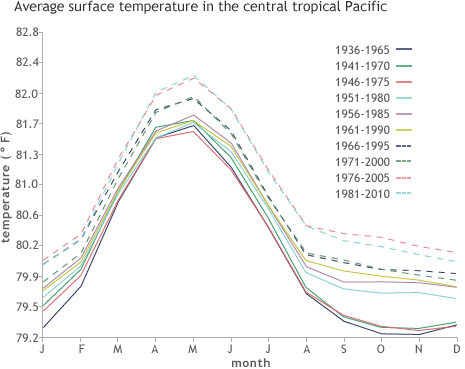
The average monthly temperatures in the central tropical Pacific have been increasing. This graph shows the new 30-year averages that NOAA is using to calculate the relative strength of historic El Niño and La Niña events. Graph adapted by Climate.gov team from original by the NOAA Climate Prediction Center.
The past three decades have been the warmest on record both globally and in the tropical Pacific. Compared to this new, warmer ocean, historic cold episodes look even colder, while historic warm episodes look weaker. Instead of providing consistency, updating the historic events was going to distort the ENSO climate record.
“We could picture a day not too far in the future,” explains Mike Halpert, Deputy Director at CPC, “when a weak El Niño episode from the past would wind up looking like a weak La Niña episode when compared to the more recent, warmer ocean temperatures.”
To deal with the reality of climate change, Climate Prediction Center scientists decided, after brainstorming with colleagues at the International Research Institute for Climate and Society, to start using fixed 30-year averages. Each five-year period in the historical record now has its own 30-year average centered on the first year in the period: the years 1950 to 1955 are compared to the 1936-1965 average, for example, while the years 1956-1960 are compared to 1941-1970.
This approach works smoothly up through the 1996-2000 period, which uses the 1981-2010 average. However, the 2001-2005 period will require the 1985-2015 base period, and 2006-2010 will need the average from 1991-2021.
Until those years are available, CPC will use the most recently calculated climatology, which, for now, is the 1981-2010 average. They will update the climatology every five years. The next update will be in 2016, at which point the average for calculating La Niña and El Niño for the current decade will shift to the 1985-2015 period.
La Niñas We Didn’t Know We Had
The change in the way the Climate Prediction Center calculates the Pacific’s average temperature has already shaken up a couple of items in the table of historic El Niño and La Niña events. The revisions confirm that it was time to make a change.
In the last version of the table, all the temperature anomalies were based on the 1971-2000 average, which was relatively cool compared to the past three decades. Against that background, some periods of cooler-than-average temperatures (from late 2005 to early 2006 and from late 2008 through early 2009) were not quite cold enough for long enough to qualify as an official La Niña episode.
However, the new strategy calls for the current decade to be compared to the 1981-2010 average—the three warmest decades on record. When NOAA scientists updated the table, the cool periods in 2005/2006 and 2008/2009 emerged as true La Niña episodes.
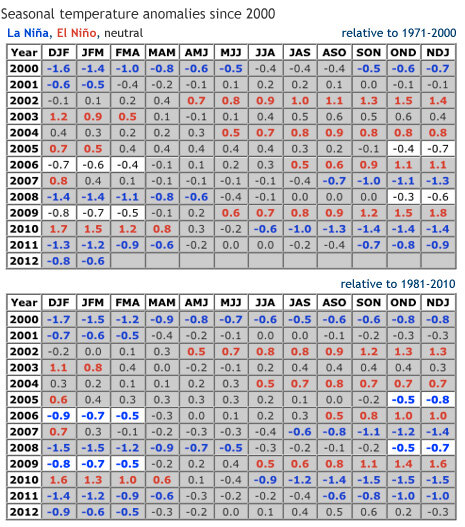
When scientists used the 1971-2000 average (top) for comparing the strength of historic ENSO events, the influence of long-term warming in the tropical Pacific made recent El Niño events seem stronger than they were and made La Niña events hard to detect. When scientists compared temperatures from the past decade to the warmer 1981-2010 average (bottom), two new La Niña events (un-shaded boxes) emerged from the record. Graphics adapted by Climate.gov team from originals (here and here) by the NOAA Climate Prediction Center.
The newly emerged 2006 and 2009 La Niñas mean that 2012—also a La Niña year—is no longer officially the “warmest La Niña year on record,” as the National Climatic Data Center initially concluded in early January. That record will now go down as a tie between 2006 and 2009, with 2012 coming in a close third.
References & Links
Description of changes to the Oceanic Niño Index
Climate Variability: Oceanic Niño Index
Cold and warm episodes by season
L’Heureux, M. L., Collins, D. C., & Hu, Z.-Z. (2012, March.). Linear trends in sea surface temperature of the tropical Pacific Ocean and implications for the El Niño-Southern Oscillation. Climate Dynamics, 1–14. doi:10.1007/s00382-012-1331-2
Reviewed by Michelle L’Heureux and Mike Halpert, NOAA Climate Prediction Center, and Jessica Blunden, National Climatic Data Center.
![]()