2014 National Temperature Recap
53 seconds
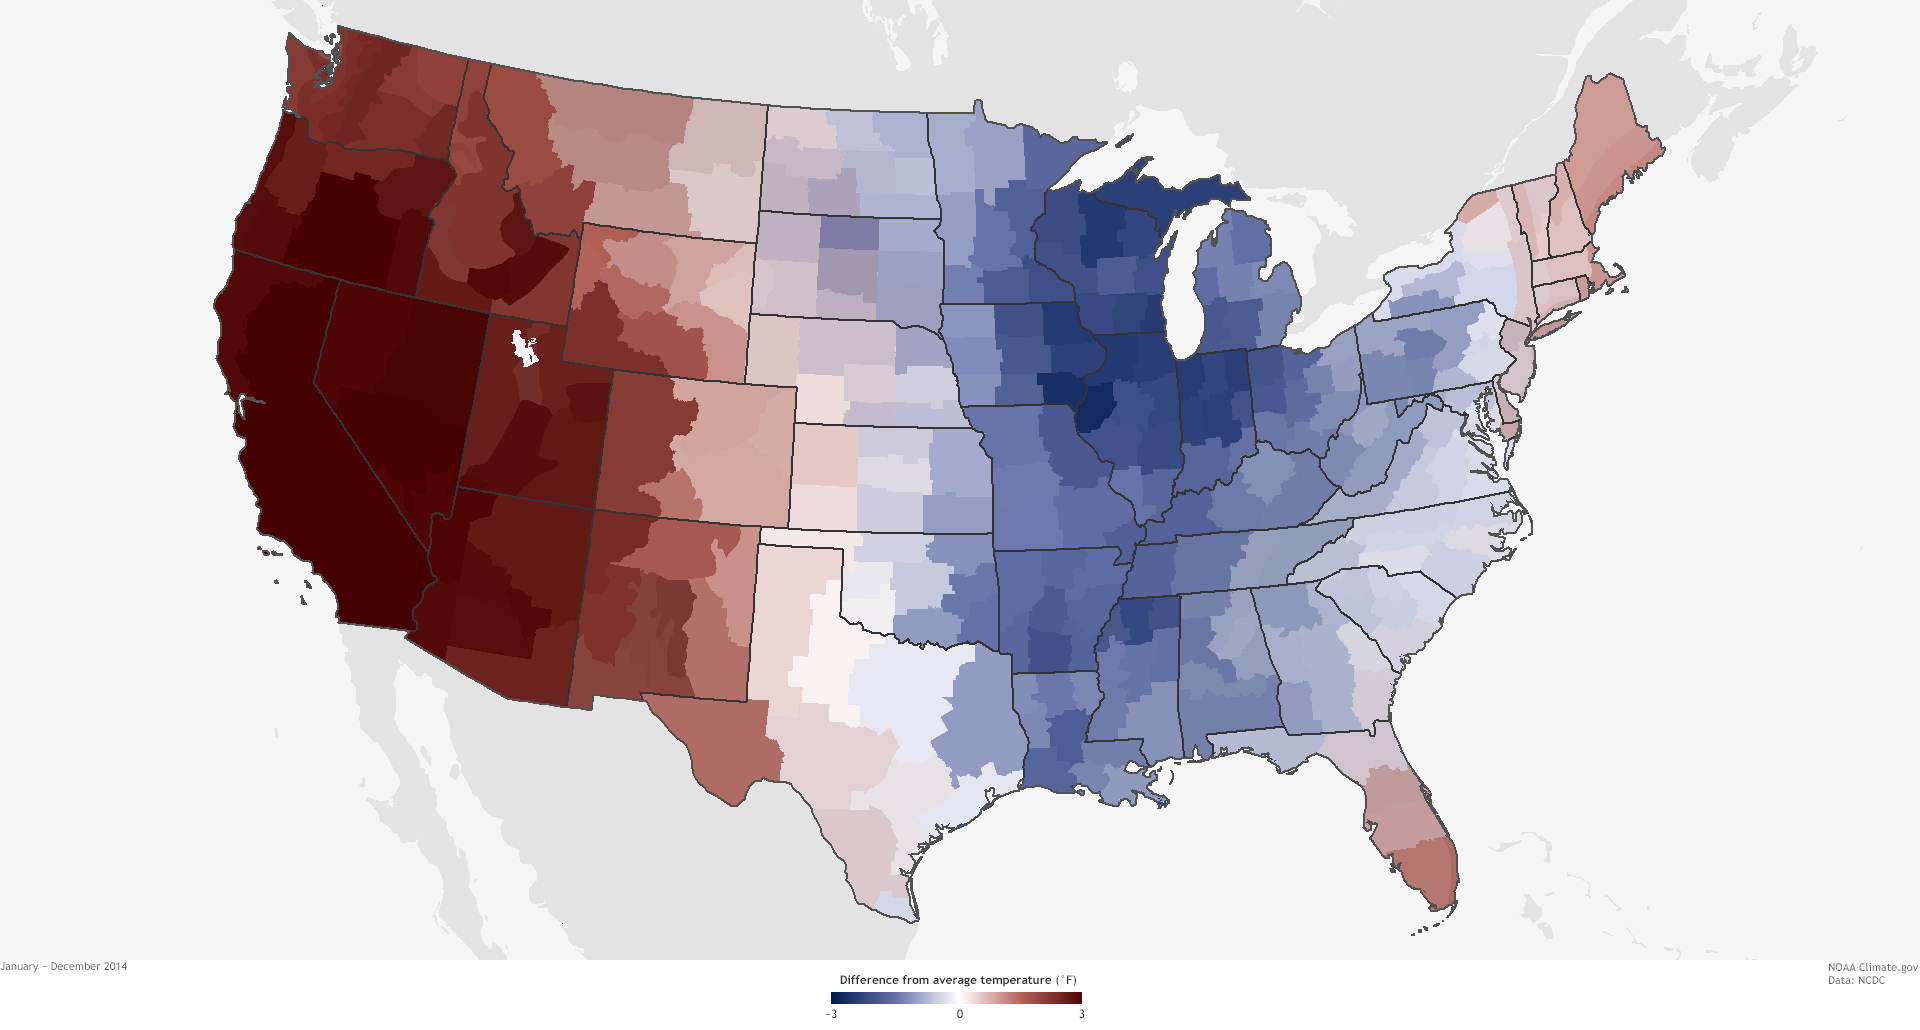
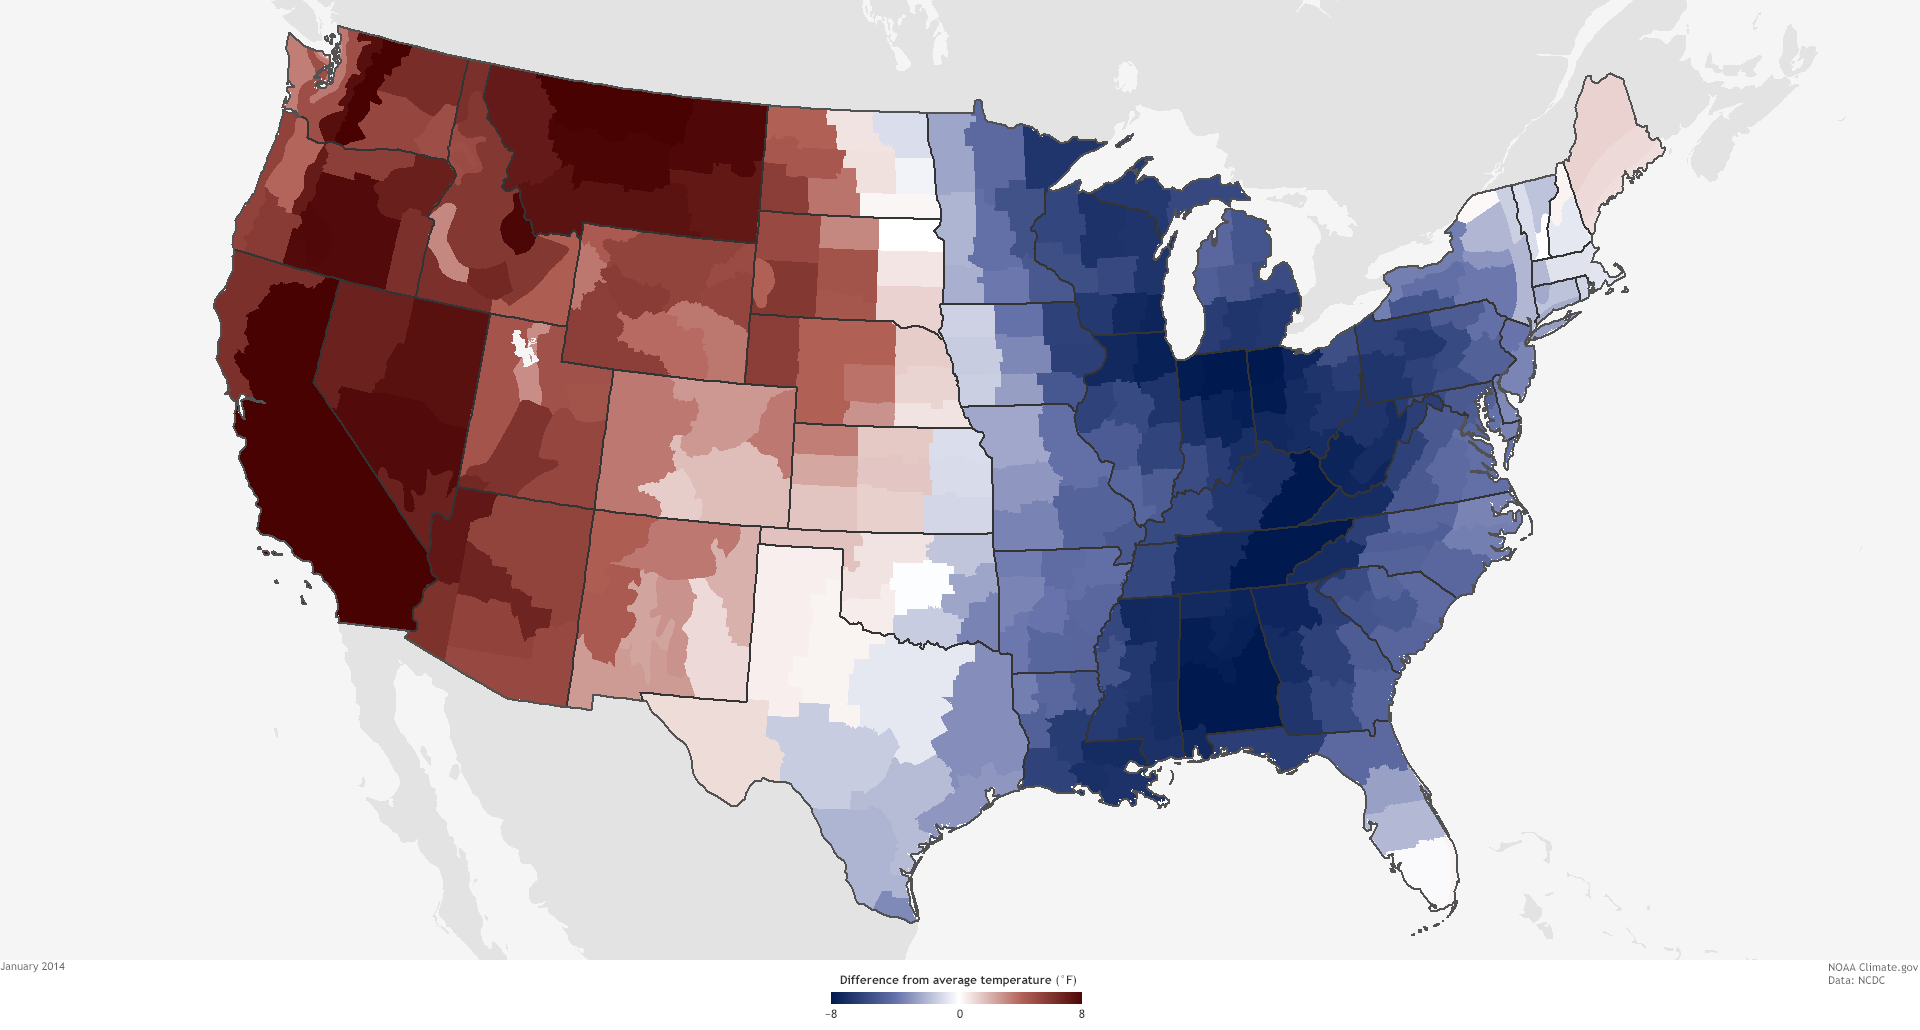
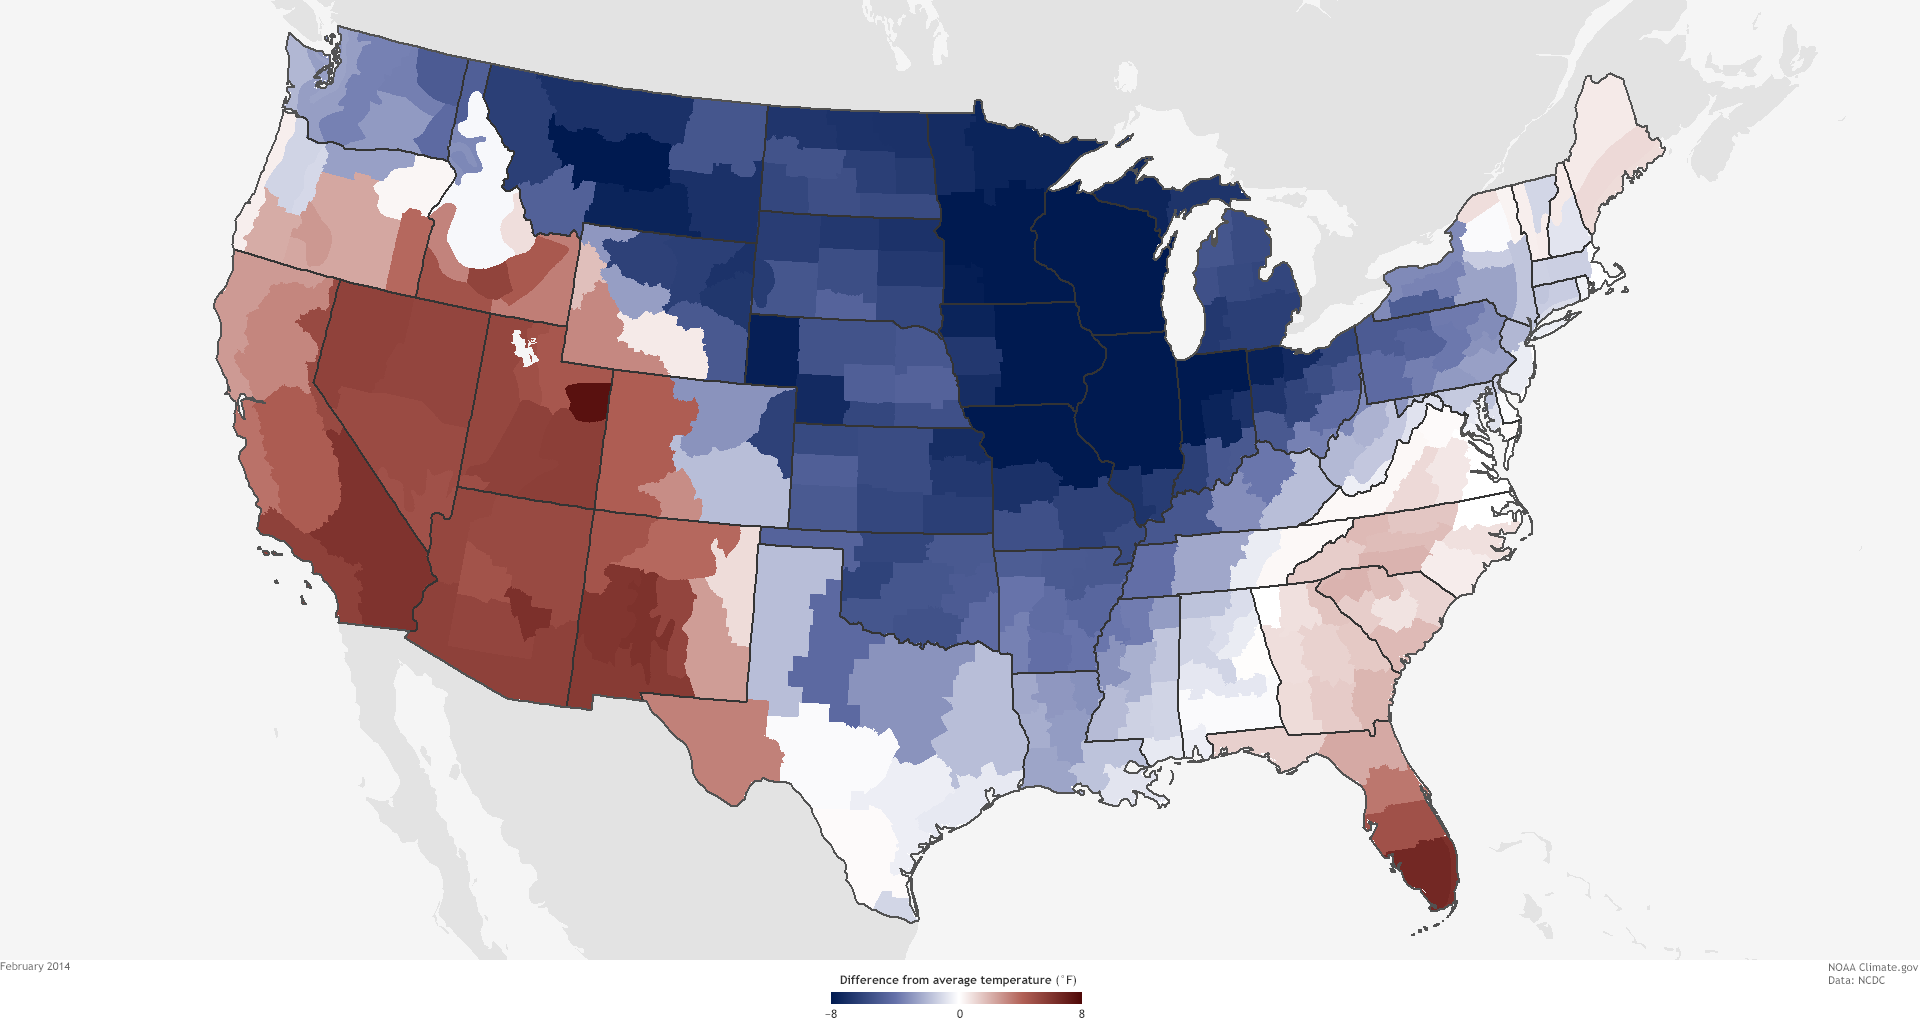
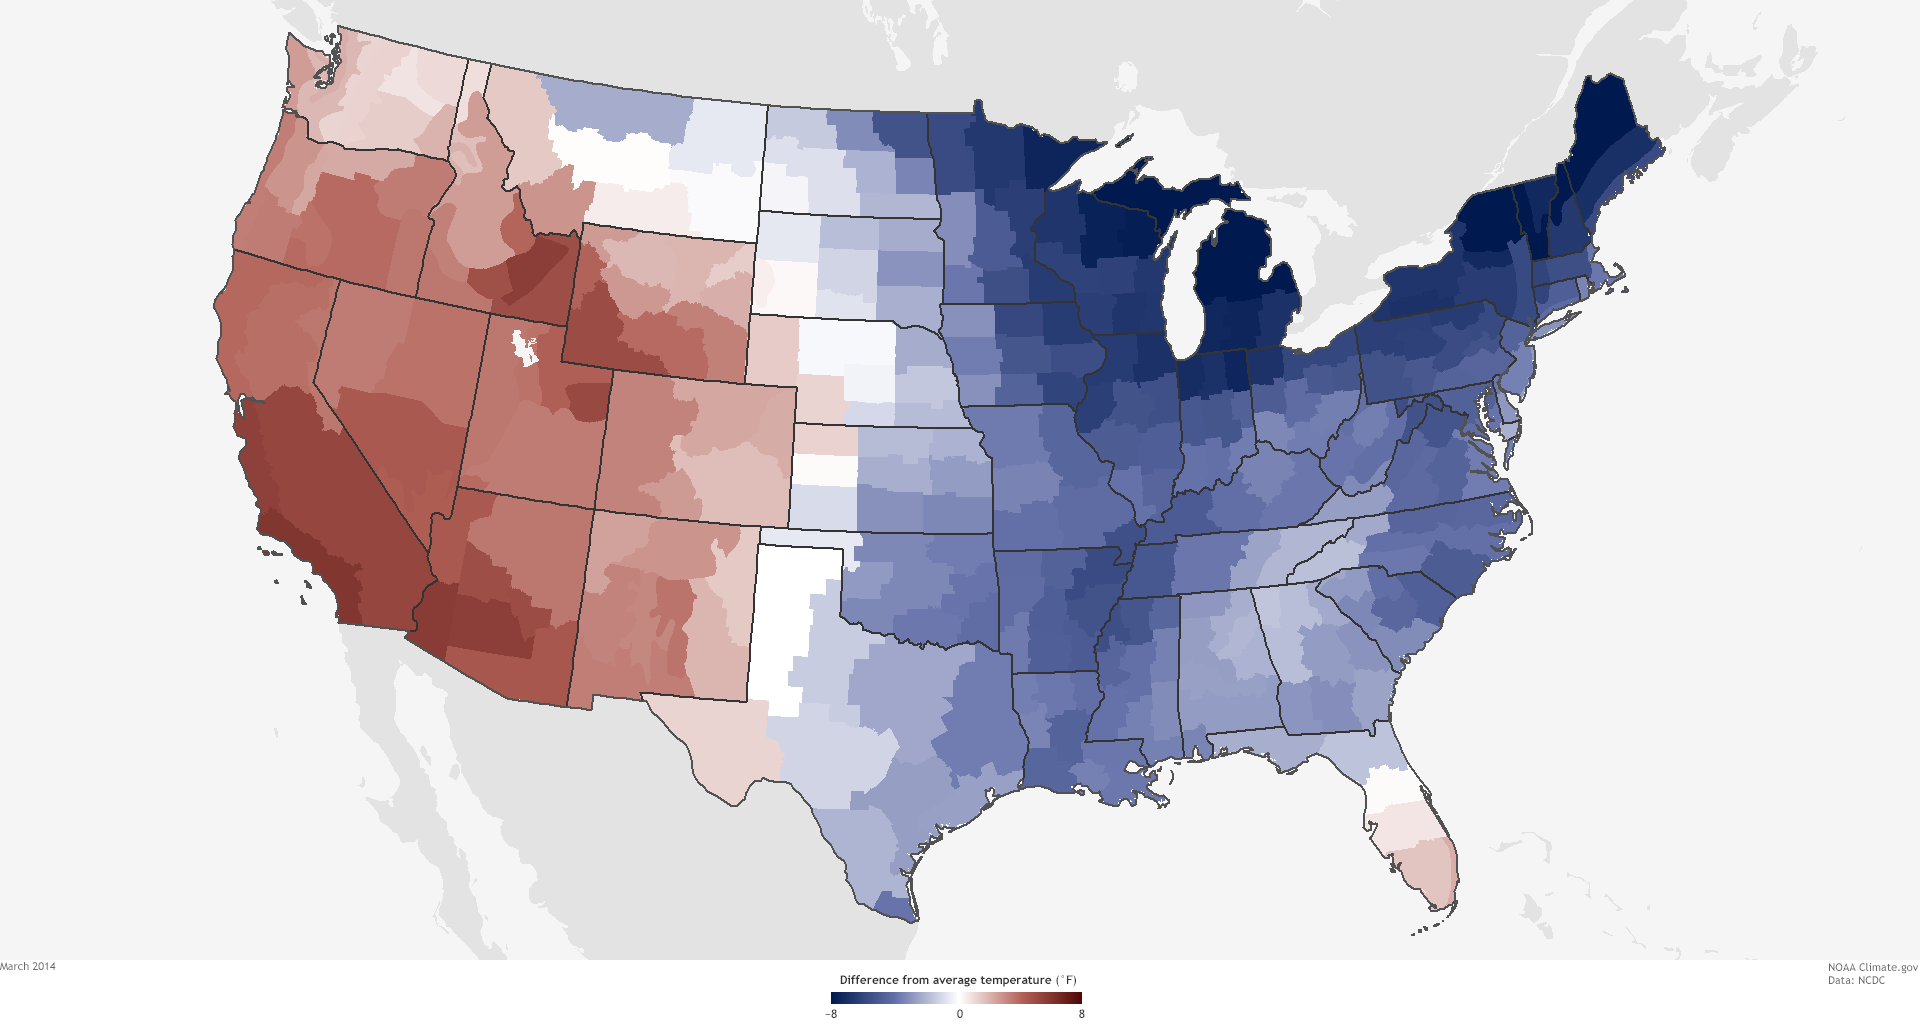
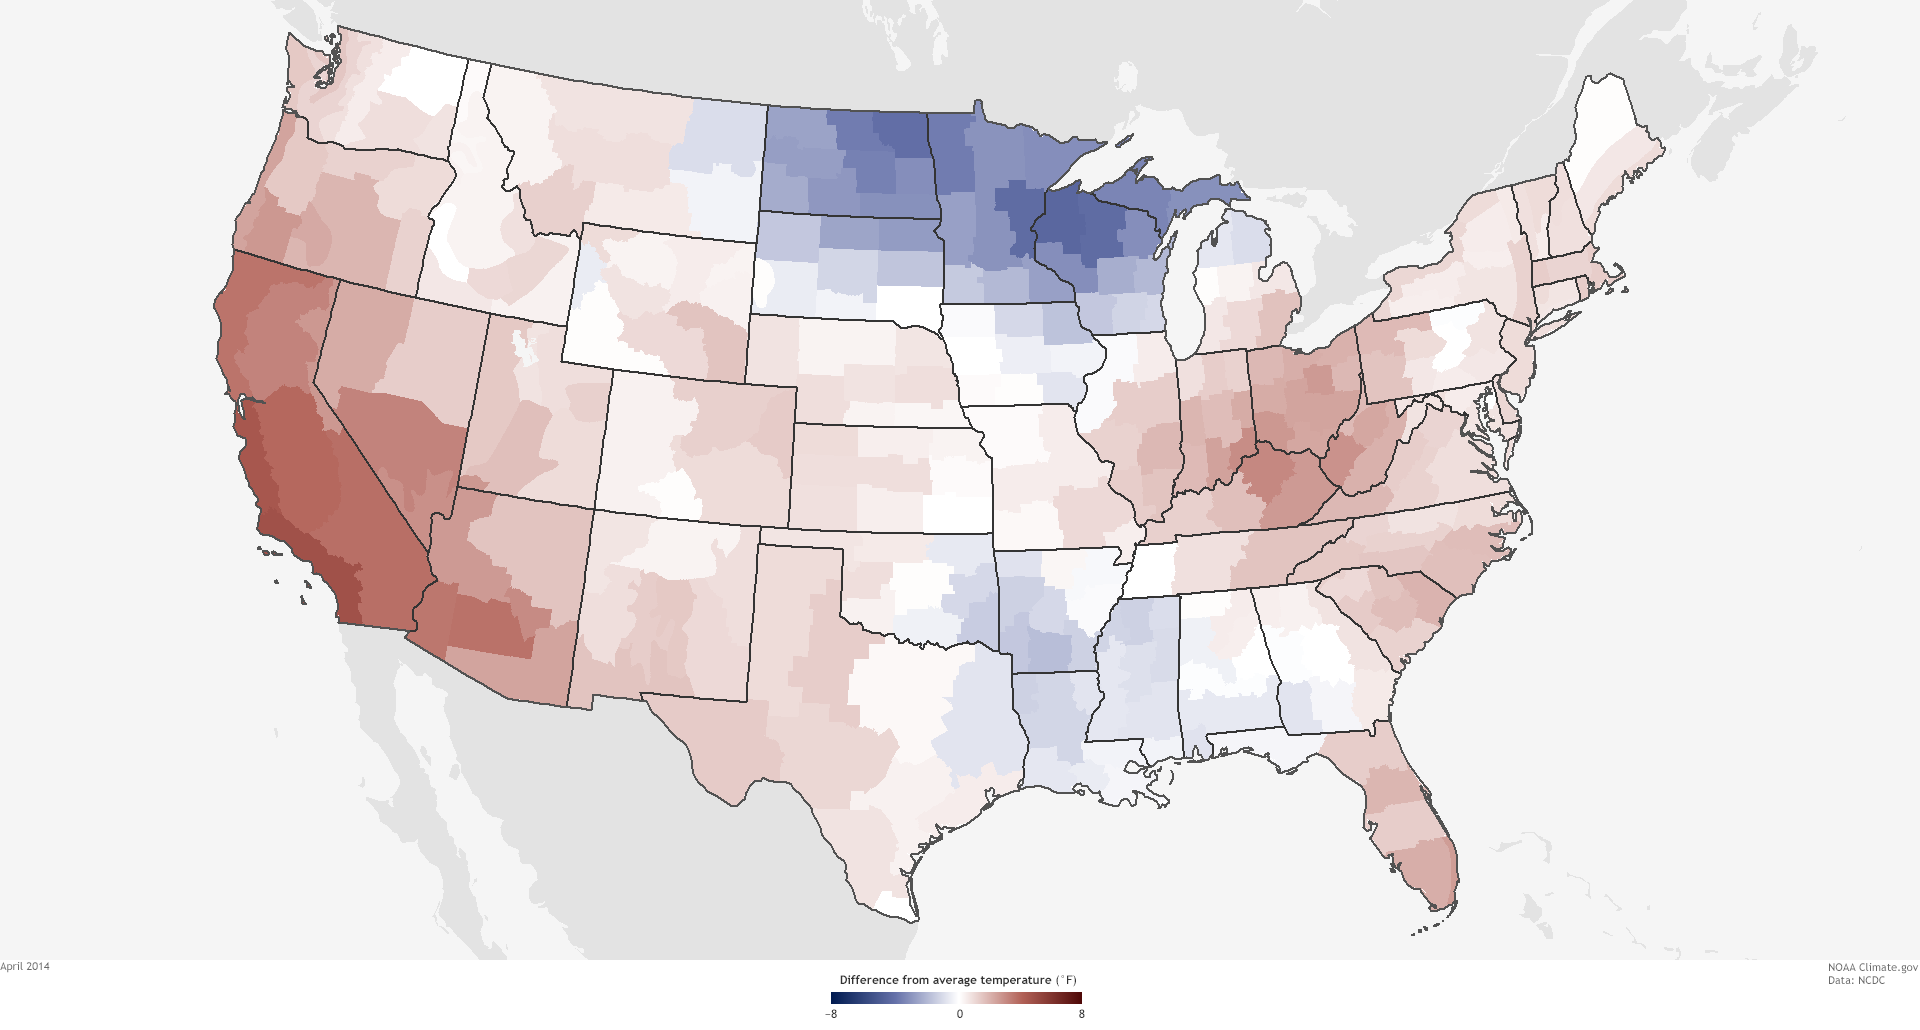
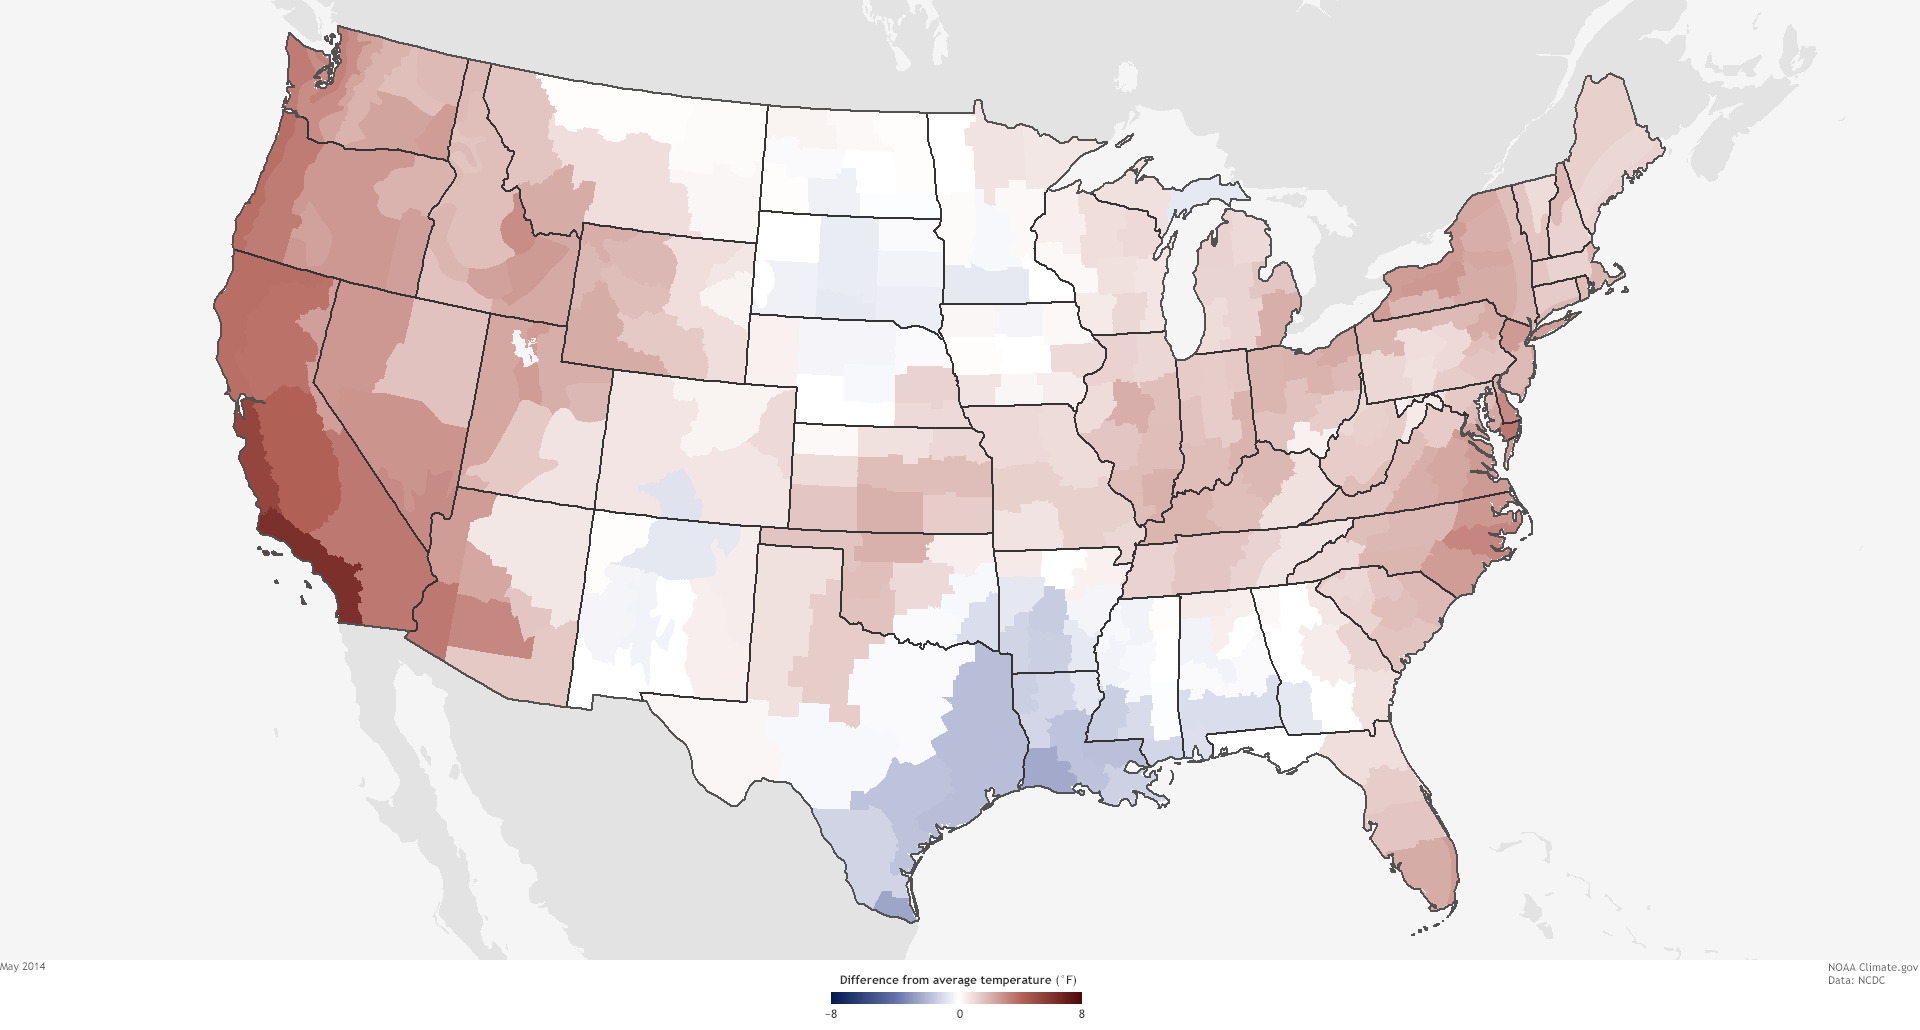
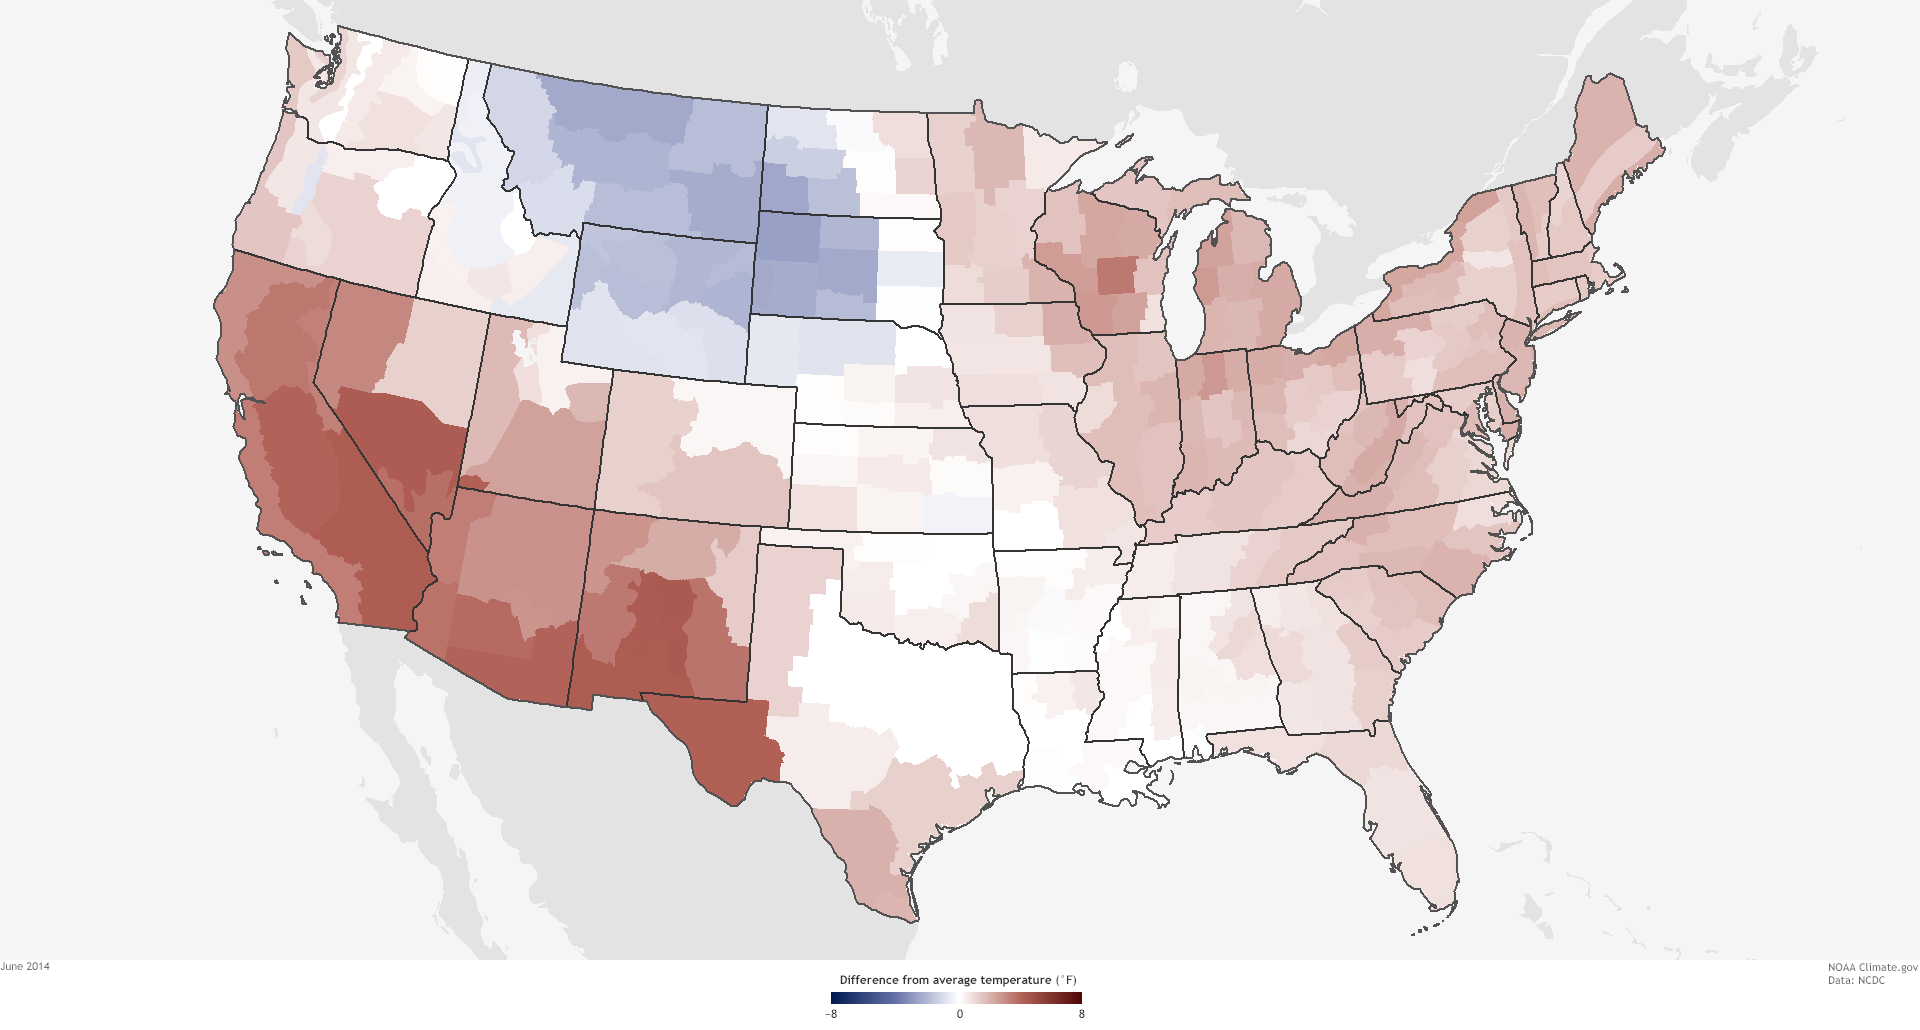
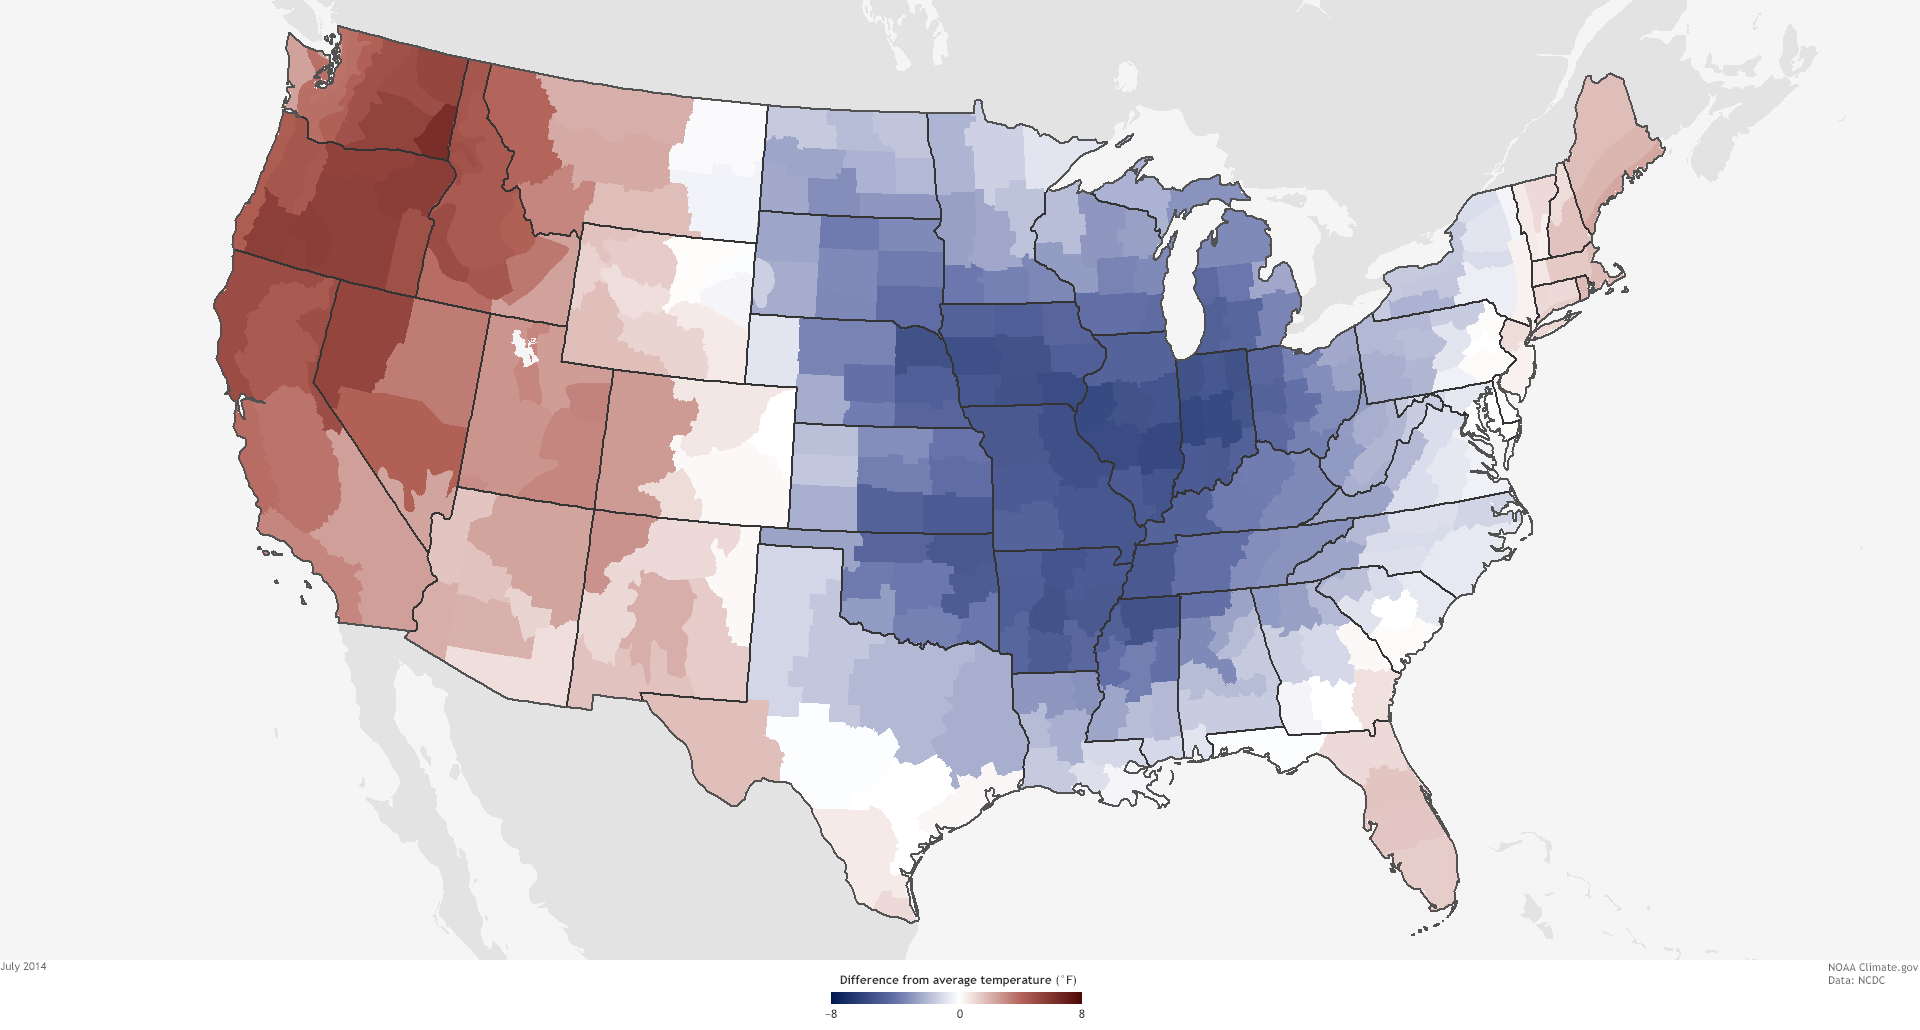
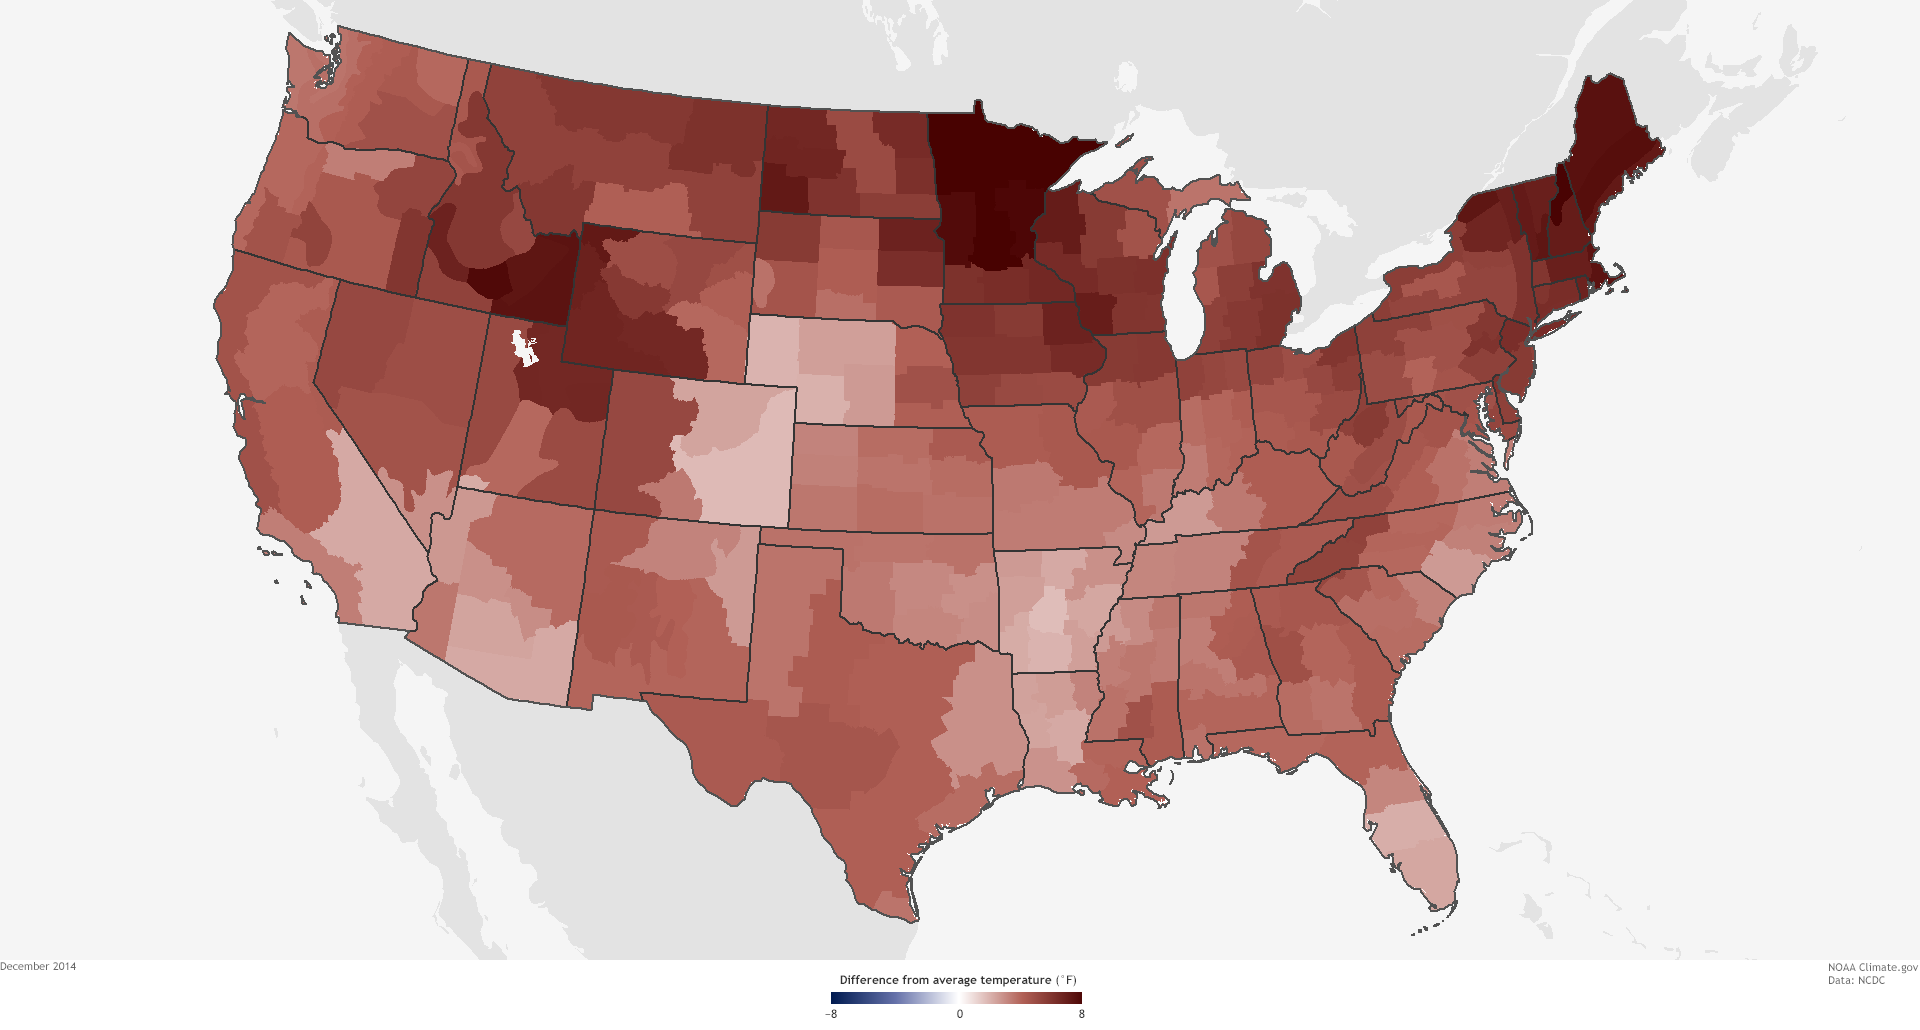
This animation shows 2014 annual and monthly temperatures for the United States compared to the twentieth-century average.
Details
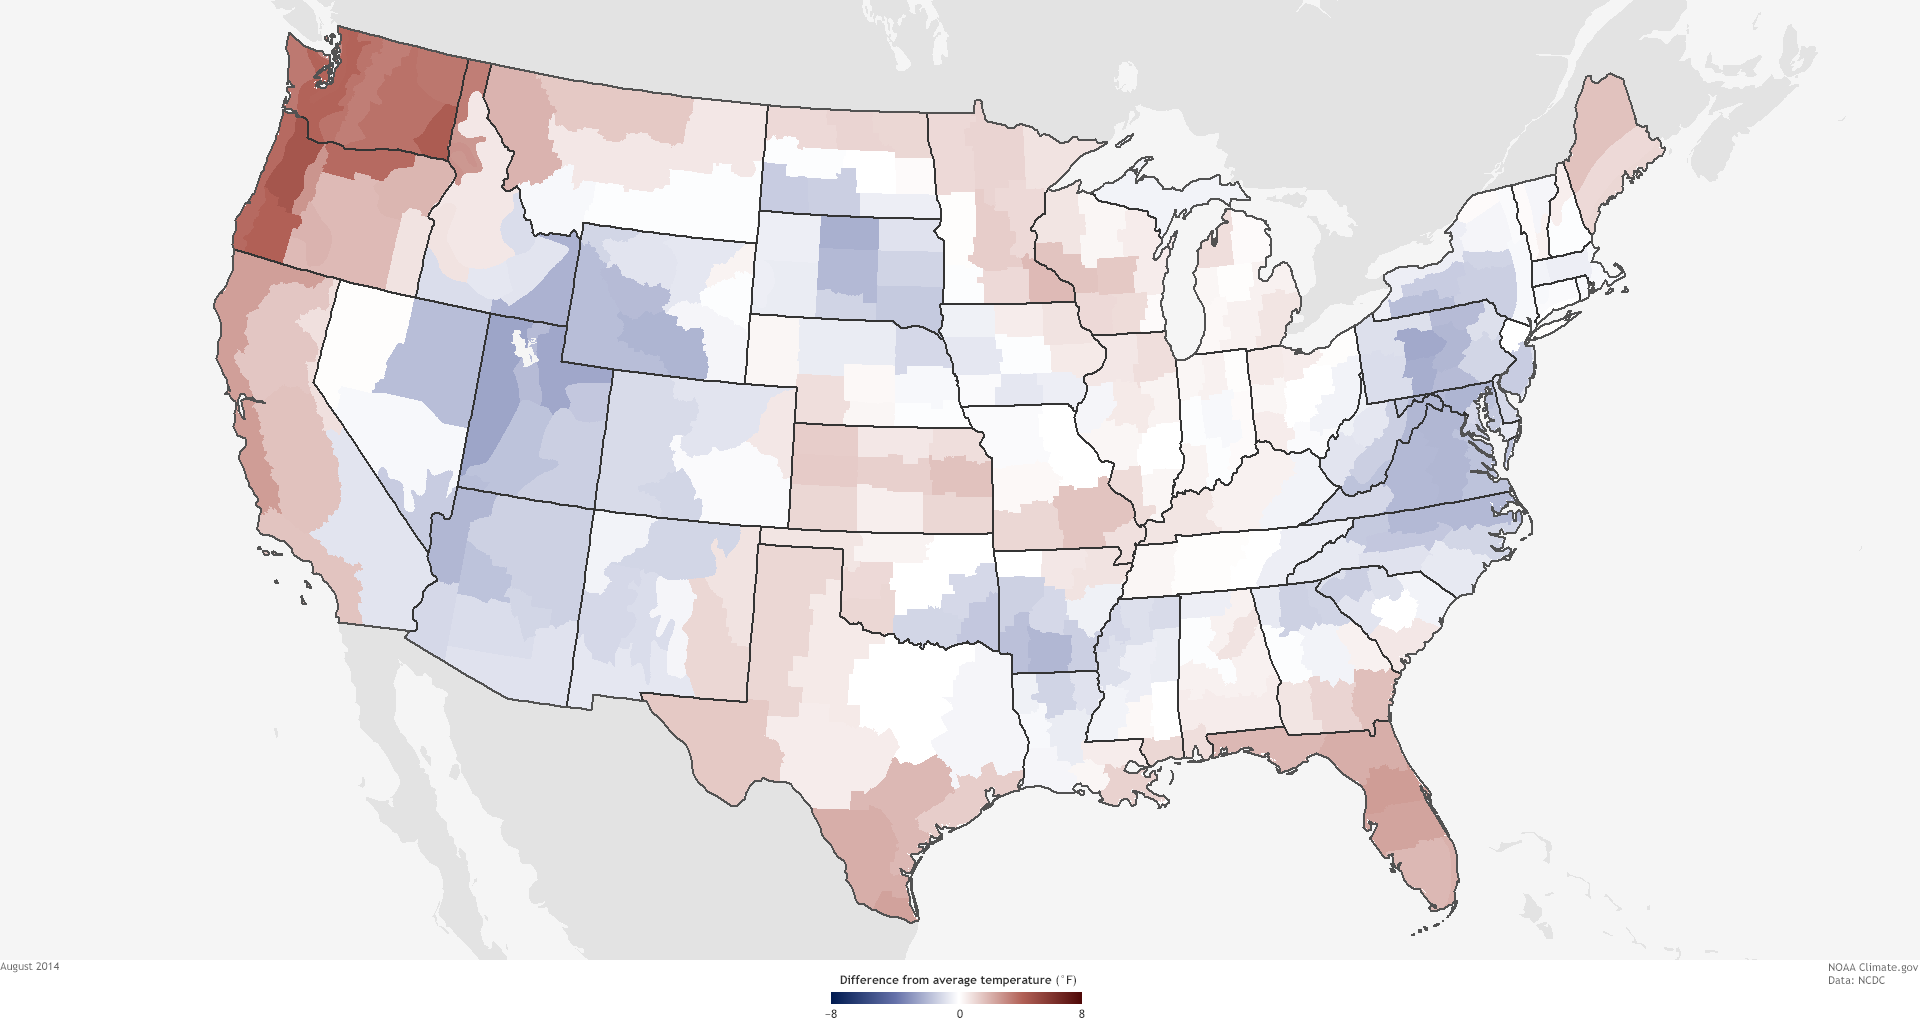
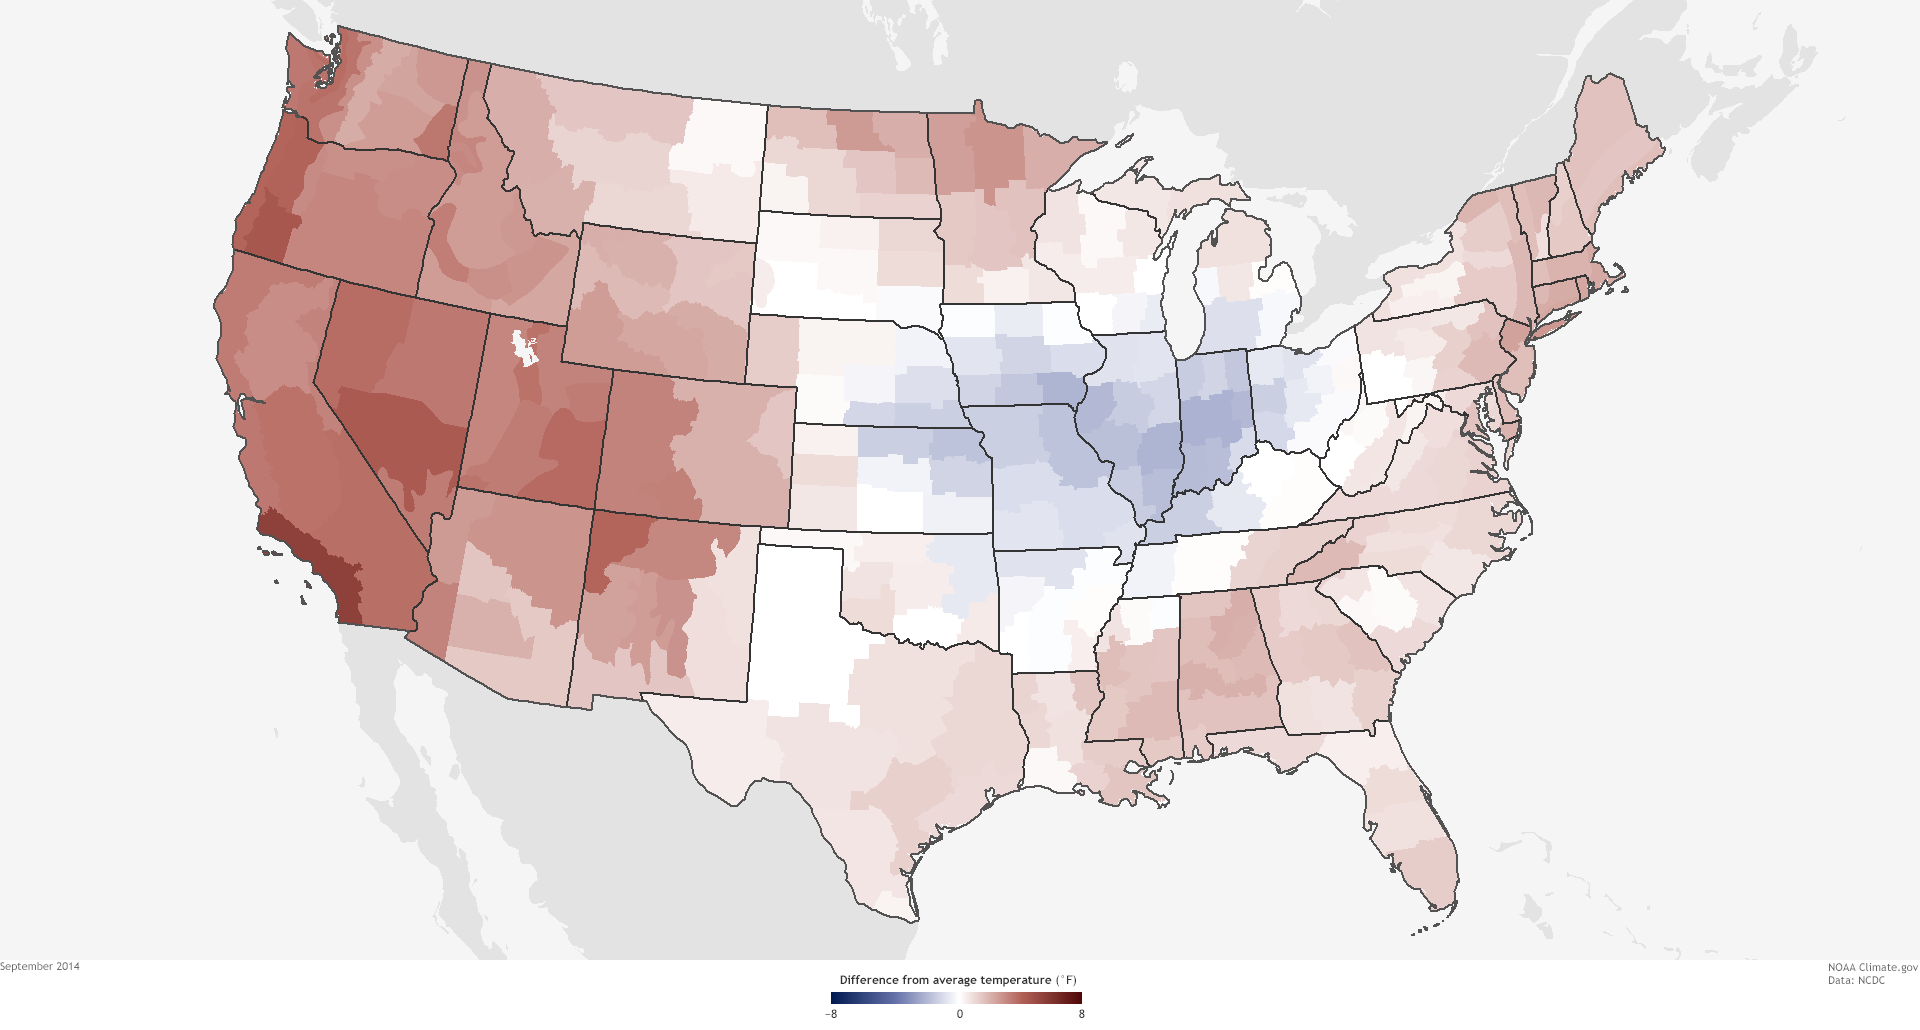
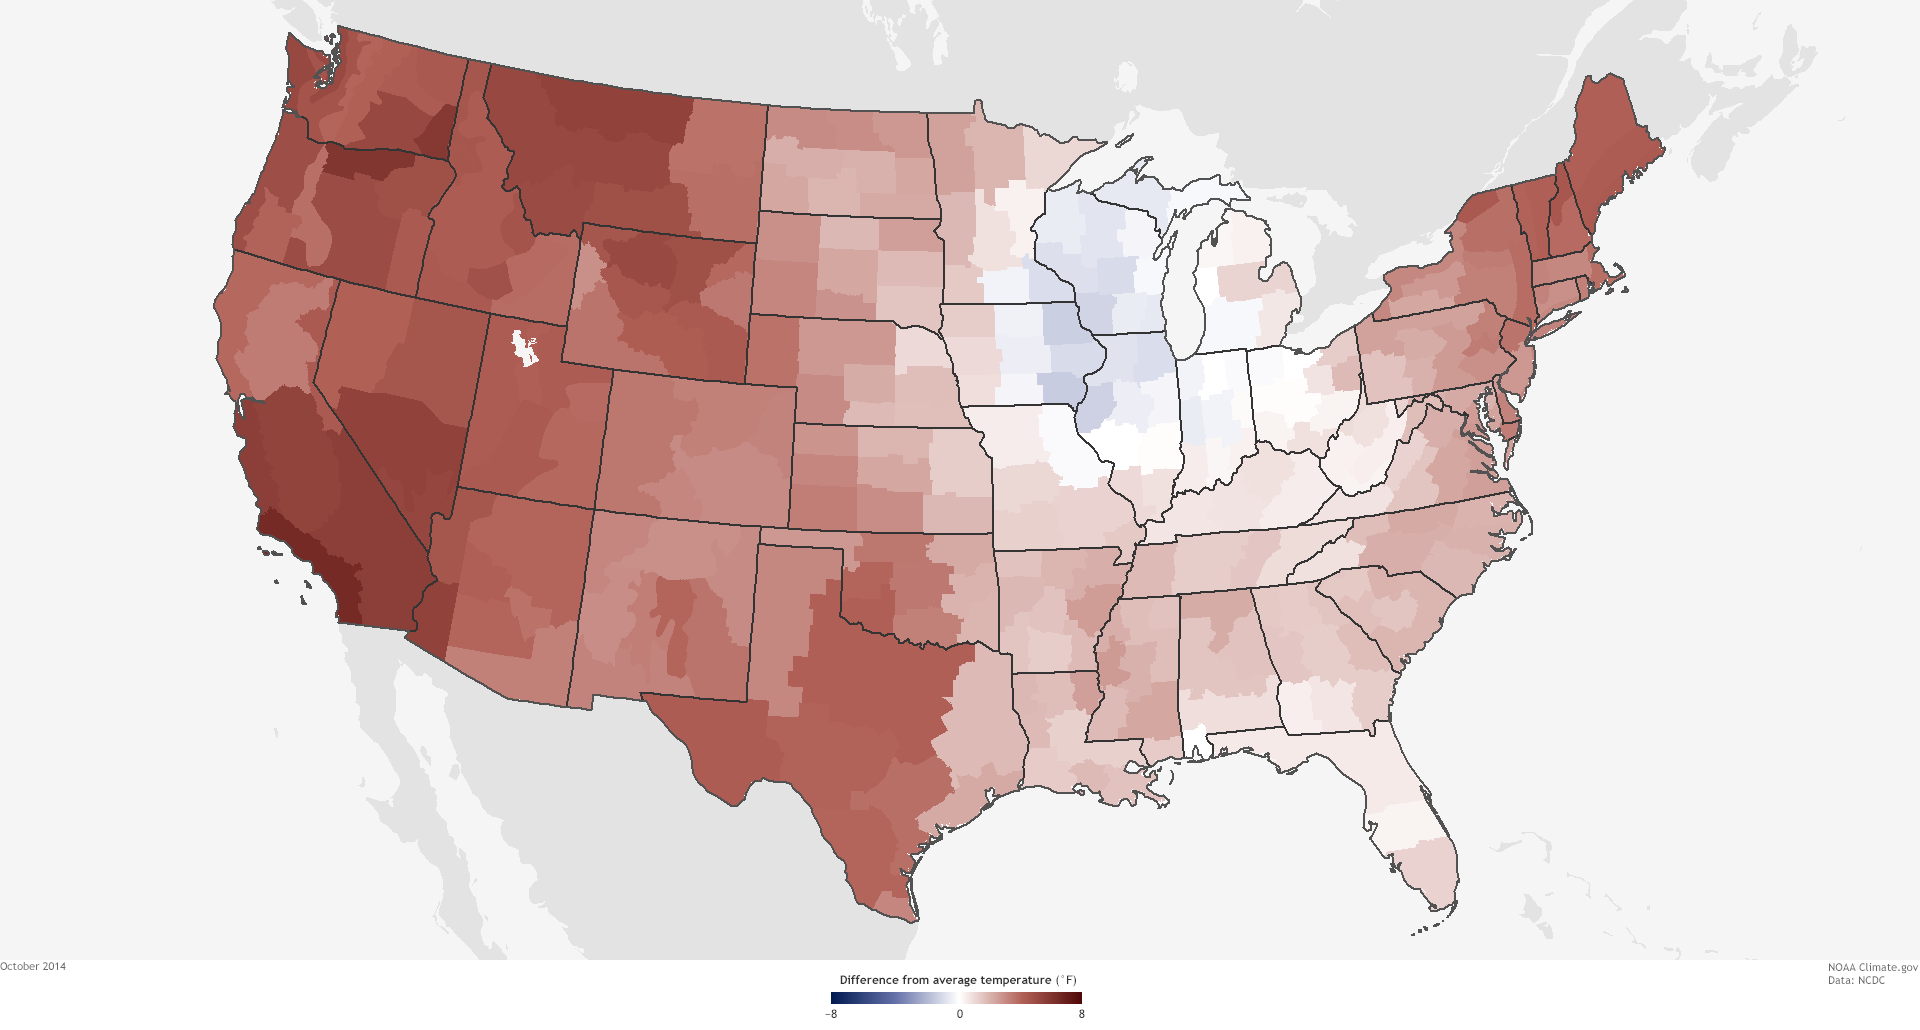
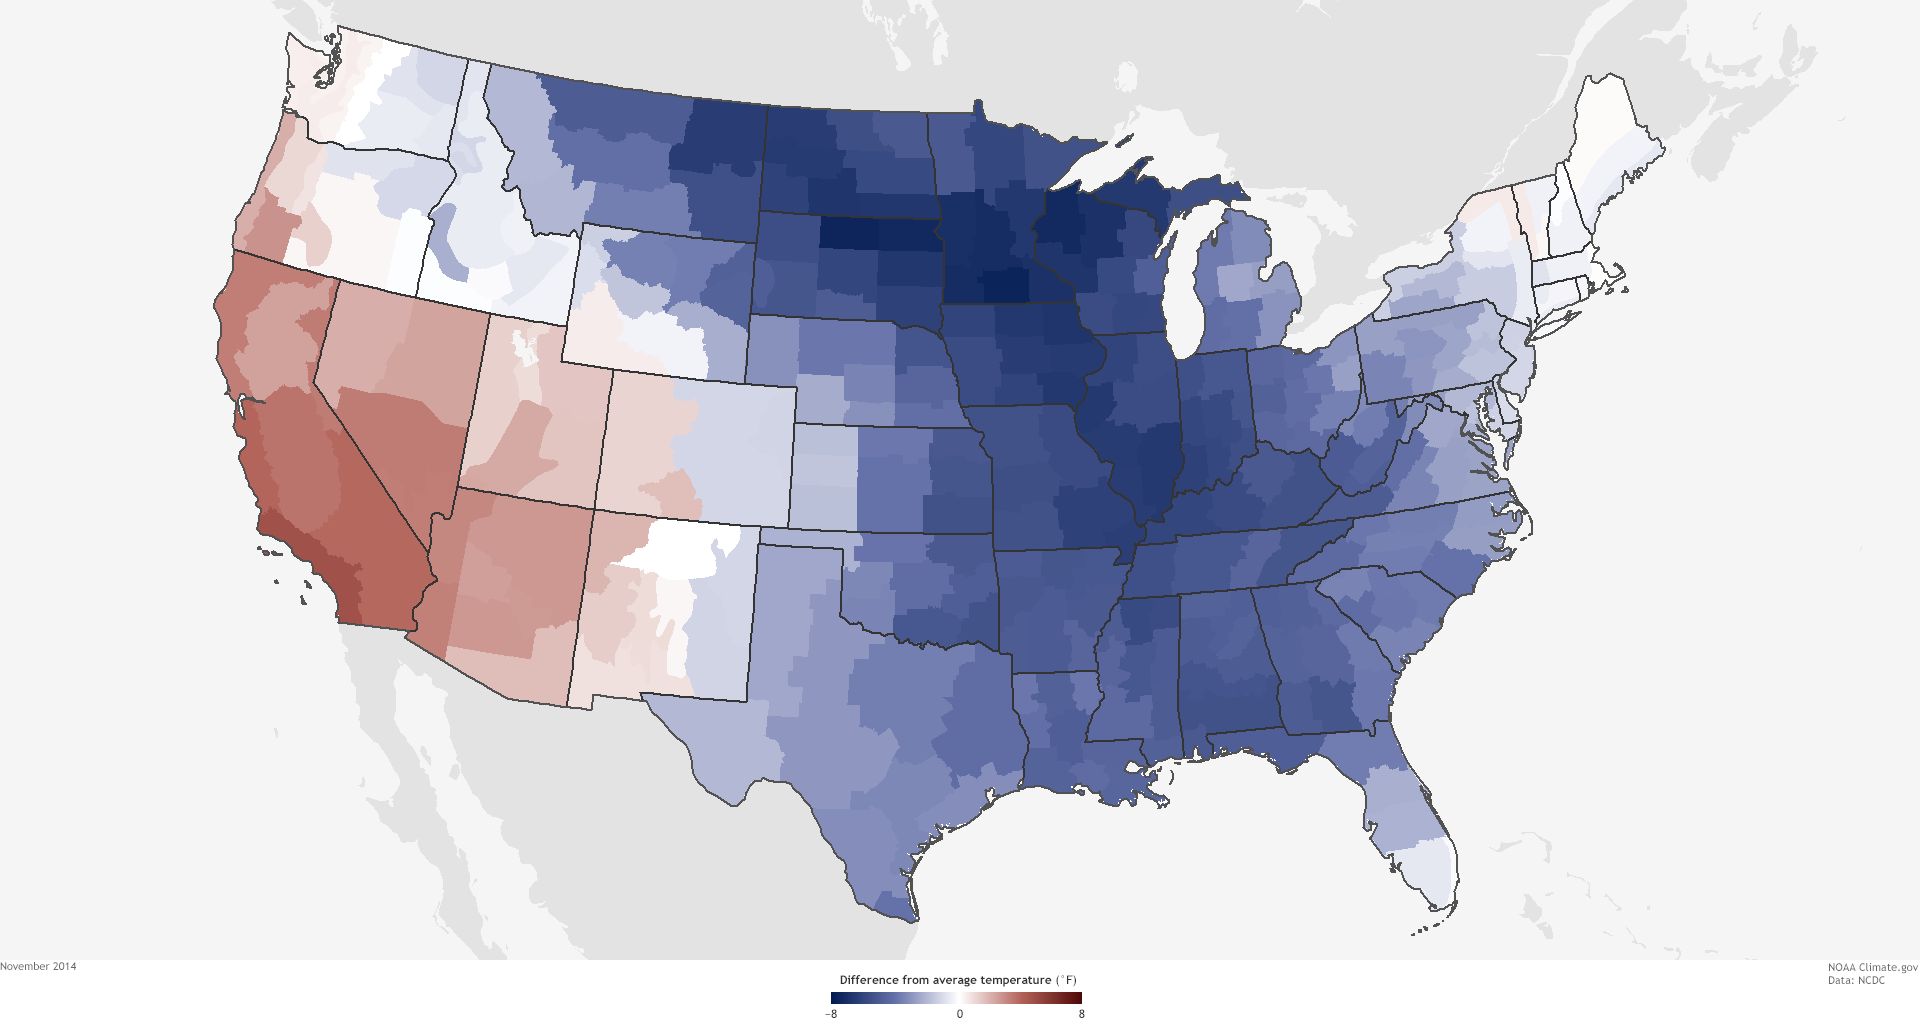
This animation shows 2014 annual average temperature for the contiguous United States compared to the twentieth-century average (1901-2000), followed by monthly maps of difference from average temperatures for each month January through December 2014. Maps are based on U.S. Climate Division data from NOAA’s National Climatic Data Center.
The Lower 48 United States was 0.5°F above average in 2014, making it the thirty-fourth warmest year in the historical record (1895-2014). Nine states across the West had a top-10-warmest year, while seven states across the Midwest and Mississippi Valley had a top-10-coolest year.
Monthly temperatures swung widely from warm to cool to warm late in the year. The year ended with the second warmest December on record. Overall, it was the eighteenth year in a row with annual temperature warmer than the twentieth-century average.
For more 2014 national climate statistics, visit
http://www.ncdc.noaa.gov/sotc/summary-info/national/2014/12
********
FAQ: Why don’t you show Alaska or Hawaii?
The shorter length and sparser geographic coverage of the data records for our nation’s most far-flung states makes it difficult to combine those records with others from the rest of the United States in a single, consistent analysis. You can obtain climate statistics for individual observing stations from the National Weather Service Regional Headquarters’ websites for Alaska and Hawaii.