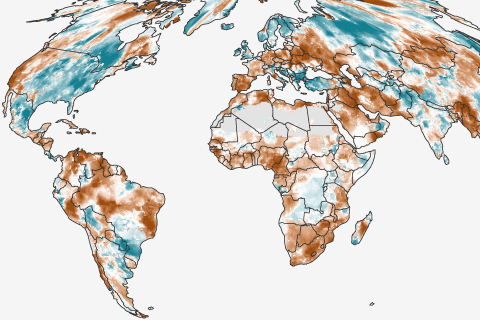
2015 was a tough year for vegetation, both natural and agricultural, with a near-record area of global land surfaces in some state of drought.
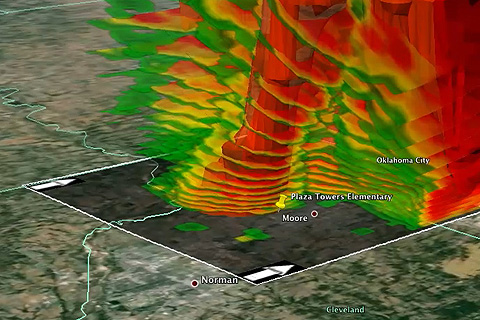
(VIDEO) Visualizing data makes it easier to understand exactly how an extreme weather event affected people’s lives, livelihoods, and property and how those things could be affected in the future. Knowing how to access and analyze the wide variety of datasets needed to study those events can be a challenge, however. NOAA's Weather and Climate Toolkit makes the job easier.
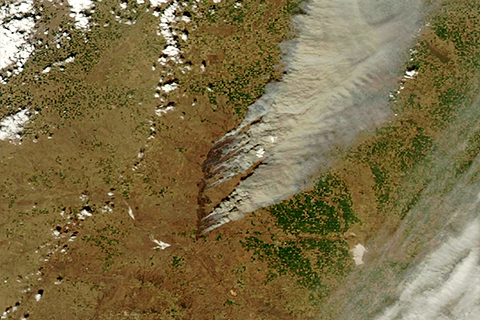
In this week's Beyond the Data blog, Deke Arndt explains the climate behind this spring's prairie fires.