Even though the severe weather season started off slow for much of the Midwest, May has been quite active for severe thunderstorms, tornadoes, and torrential rains. On May 6, severe thunderstorms formed across the heart of Tornado Alley from southern Nebraska, south through Kansas, Oklahoma, and into northern Texas. According to the AP, twelve people were injured in the resulting tornadoes across the Plains (preliminary reports were of 65 tornadoes), with officers twice having to evacuate the airport in Oklahoma City.
On May 6, 2015, heavy rain swept across Oklahoma City. These radar images show light rain in pale blue, moderate rain in medium blue, and very heavy rain in purple. Climate.gov animation by Hunter Allen, based on National Weather Service data.
But tornadoes were not the only worry. In just 24 hours on May 6, slow-moving thunderstorms dropped an astounding 7.10 inches of rain at Will Rogers World Airport in Oklahoma City. On average, the city gets 4.65 inches in the whole month of May. Between 7 and 8 p.m.—just one hour—3.04 inches of rain came down. Rainfall totals estimated from radar data even exceeded eight inches to the west of the city. In total, the rains made May 6 the wettest day on record for May and the third wettest day overall in Oklahoma City, according to records that go to 1891.
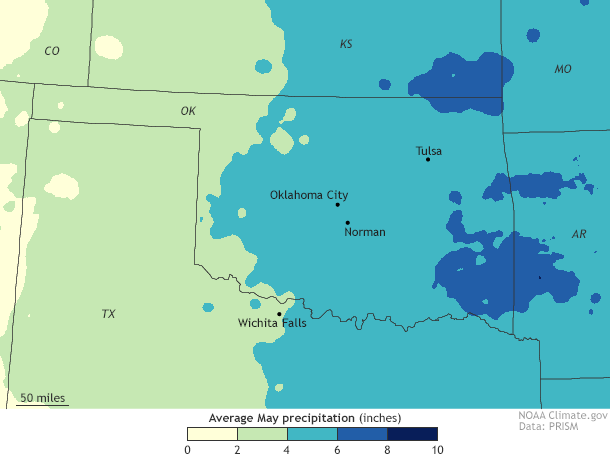
Average precipitation for Oklahoma and surrounding areas during the month of May. In general, four to six inches of rain is usually observed across Oklahoma City during May. Maps by NOAA Climate.gov based on PRISM rainfall data.
The resulting flash flooding was so bad that, for the first time in the city’s history, the National Weather Service issued a flash flood emergency. According to the AP, a spokeswoman for Emergency Medical Services Authority in Oklahoma City said that water rescues occurred “all over” Oklahoma City during the event. Fire department divers were even called upon to rescue drivers trapped in their cars by high waters.
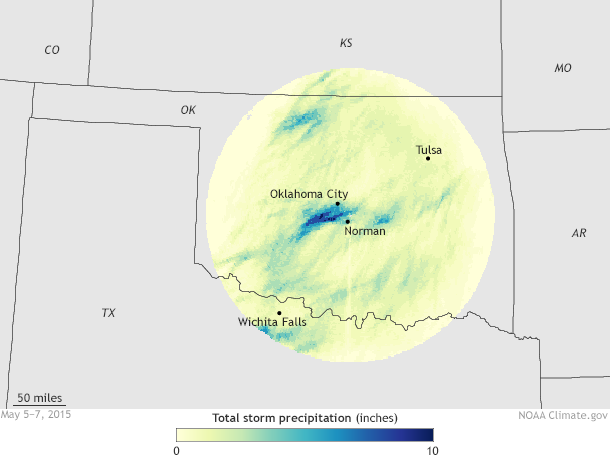
Storm total precipitation estimated by the WSR-88d radar located in Oklahoma City from 2 a.m. May 5 through 7 a.m. May 7. The bulk of the rainfall occurred on May 6, with isolated areas southwest of Oklahoma City recording over 8 inches of rain. Map by NOAA Climate.gov based on radar data archived at the National Climatic Data Center (NCDC)
Heavy rains… happen.
In the Great Plains during tornado season, deluges of rain are not “uncommon.” Most people have been deafened by the overwhelming din of torrential rain from a thunderstorm pounding against a windowpane. In other words, occasional heavy, heavy rains are a normal part of the region’s climate. Even with that said, this event was rare.
How do climate scientists describe and rank these extreme events?
Using the historical rainfall record for Oklahoma City, which dates back to 1891, we can see that receiving 7.10 inches of rain in just 24 hours is likely to occur just once every 25 years or so. In fact, only four days previously in history have reported over seven inches of rain in one day at Will Rogers World Airport.
The 3.04 inches of rain that fell between 7-8 p.m. were also a once-in-25- year event. (For comparison, events where over 3 inches of rain fall in 24 hours usually occur once every year or two.) And when that much water falls from the sky that fast, there is no place for all of that water to go. The end result was the substantial flooding across Oklahoma City.
In addition to simply ranking the total rainfall that has ever fallen over certain spans of time—the wettest hour, day, week on record—climate scientists also use a location’s historical record to describe the frequency with which events of a given magnitude are likely to occur. The bigger the event, the larger the average recurrence interval (e.g. the longer it takes for a rainfall total to repeat itself).
For instance, one inch of rain is more likely to fall on any given day than ten inches. The ten inch event would have a higher recurrence interval (1 in 200 years for Oklahoma City) while the one inch event could occur ten days each year. In Oklahoma City’s case, an event of the magnitude recently seen (7.10 inches in one day) recurs on average every 25 years. Or said in another way, every year there is a 4% (1 in 25) chance of an event with that magnitude occurring.
But scientists can also use the historical record to declare an event a 1-in-100- or 1-in-500-year event. How can anyone say that when we only have a centuries worth of observations (124 years, in the case of Oklahoma City, for example)? What kind of hocus pocus is this? Well stay tuned. I’ll get into that in my next post.