No, you can’t blame it all on El Niño
...but it's still a seasonal forecaster's best friend.
After El Niño conditions were declared in March and Climate Prediction Center’s latest forecast predicted El Niño’s continued strengthening during the upcoming summer and fall, I think it is safe to say we are well within the time period where everything will be blamed on El Niño.
It rained on your wedding day? El Niño. Had an outdoor picnic ruined by a late afternoon thunderstorm? El Niño. Was it hot …during the summer? El Niño.
Usually these are exaggerations. Mike Halpert and Tony Barnston in past posts have shown what type of U.S. and global impacts are associated with an El Niño for the late fall and winter and for the summer, respectively. But aside from its effect on seasonal hurricane activity, El Niño impacts over the US during the summer are minimal at best.
Granted, El Niño does have substantial impact on rainfall patterns elsewhere globally during June through August. However, it is hard to overcome the suspicion that El Niño is pulling all the atmospheric strings and creating an ever-increasing amount of extreme weather events compared to a year without an event.
So allow me to ask some simple questions. Is El Niño causing every weather event we see? Are there a greater number of extreme precipitation events during El Niño years than a normal year? How do we benefit from knowing where El Niño can influence these events?
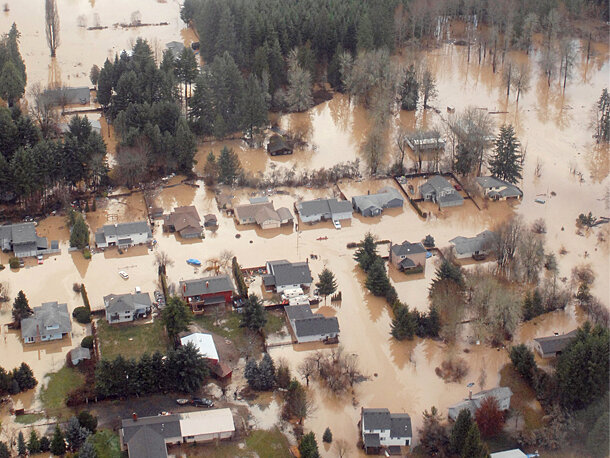
An aerial view of the flood-stricken town of Vernonia, Oregon, on December 4, 2007—a La Niña year—taken from an Oregon Army National Guard helicopter. Photo courtesy Sgt. Nick Choy, U.S. Air Force.
When we talk about El Niño, we often talk about certain patterns in average rainfall that are observed across the globe in El Niño years. Often overlooked is that ENSO is not the only influence on where or how much rain falls in any given region in a given year. ENSO is only the cause of roughly 15-20% of the extreme precipitation (Dai et al 1997). The rest, 80-85%, is due to other factors on our planet. If extreme precipitation was a large pizza, ENSO would account for only 2 slices.
And because ENSO does not control 100% of the precipitation extremes and because weather is, well, weather—somewhat chaotic—no single El Niño or La Niña year will be a perfect match with the idealized “El Niño” or “La Niña” pattern. All of which leads to the conclusion that, for most of you, while I apologize that your [insert outdoor event] got rained on, it probably wasn’t due to El Niño.
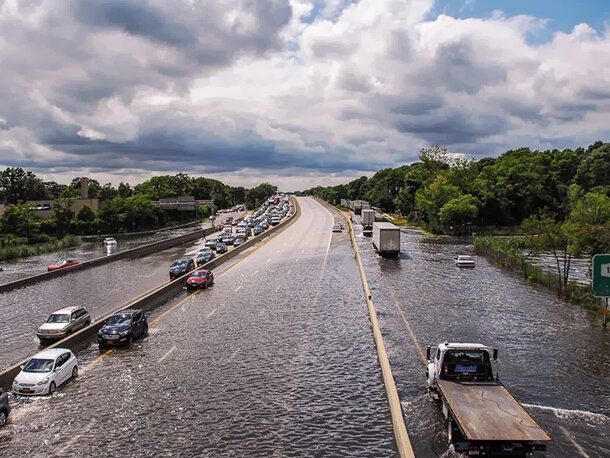
Flooding along the Sunrise Highway on Long Island, New York, following a historic rain event in mid-August, 2014—an ENSO-neutral year—that set a new 24-hour total rainfall record for the state. Photo courtesy Daniel Linek.
Even though not everything is caused by El Niño, El Niño episodes can still have a greater number of extreme precipitation events than normal, correct? After all, I have already listed many places where we see a tilt in the odds towards significant seasonal average rainfall departures from normal. While these high-profile regions of drought or excess precipitation garner plenty of headlines, research on observations since 1950 suggests only 20-30% of land areas across the globe are potentially affected during El Niño and La Niña (Mason and Goddard 2001).
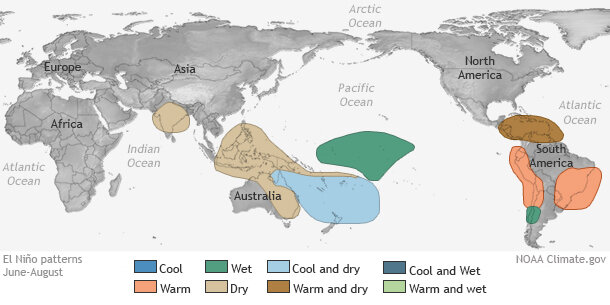
Temperature and precipitation patterns that are typical of summertime El Niño conditions. Map by NOAA Climate.gov, based on originals from the Climate Prediction Center.
What about the other 70-80% of land areas? In 2005, research by Goddard and Dilley showed that the number of large anomalies in 1-month precipitation totals over land from 30°S to 30°N is very similar regardless of whether it was an El Niño, La Niña or Neutral (Goddard and Dilley 2005). This even takes into account the regions that have ENSO impacts.
In fact, the authors found that not only are extreme precipitation anomalies during El Niño and La Niña comparable to those during Neutral conditions, but also that climate-related disasters do not increase during El Niño/La Niña years. In essence, while there could be high profile impacts in certain regions during El Niño or La Niña, there are also inevitably going to be large precipitation anomalies somewhere across the globe even during years without an El Niño or La Niña.
However, a key fact is that during neutral years, we are less likely to know where these extremes could occur. When El Niño and La Niña occur, the location of some of a given year’s biggest wet or dry events becomes more predictable.
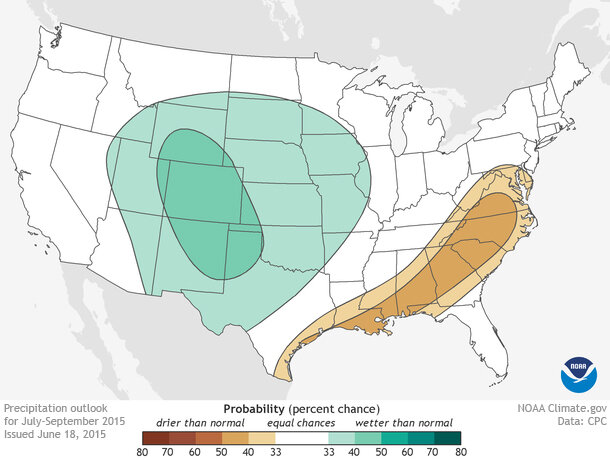
Seasonal precipitation outlook for the contiguous United States for July through September, 2015. The category (above-normal, equal chances, below-normal) with the highest probability is shaded. The outlook calls for a tilt in the odds towards wetter conditions across the central/southern Great Plains, the Rocky Mountains, and the Great Basin. Drier-than-normal conditions are likely across the Gulf Coast towards the Mid-Atlantic. Image by NOAA Climate.gov, based on data provided by the Climate Prediction Center.
So is knowing an El Niño is here or coming a good thing for a forecaster or anyone interested in making bets on the future? Only 20-30% of land areas show a repeatable pattern during ENSO events (Mason and Goddard 2001). Plus, ENSO explains only 15-20% of what is seen in extreme precipitation (Dai et al 1997), which seems tiny. If I were an actor and were told that my presence on camera accounted for only 20% of the action, I wouldn’t call home and tell my mom I’m a leading man. But, to a forecaster, that is a large amount of information.
For one thing, unlike other atmospheric patterns that influence weather for weeks to seasons—the Arctic Oscillation (AO), North Atlantic Oscillation (NAO) or Pacific Decadal Oscillation (PDO), for example—ENSO is forecastable on a monthly to seasonal time scale. And while never a guarantee, if ENSO occurs or is predicted several months in advance of its peak influence, then we can assume a tilt in the odds towards certain impacts.
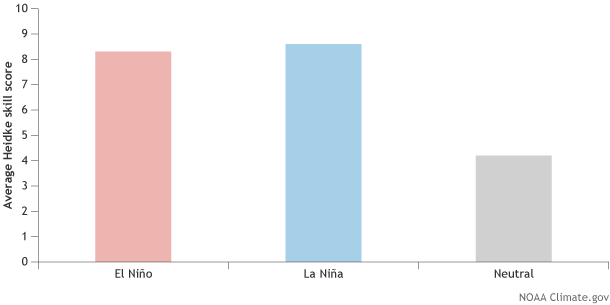
Averaged Heidke skill scores from 1995 to present for seasonal precipitation outlooks during the peak of El Niño and La Niña (October-December through February-April) separated by ENSO phase. Seasonal precipitation outlooks made during El Niño and La Niña scored higher on average than those outlooks made during neutral conditions. Image by Fiona Martin. Data provided by the Climate Prediction Center.
That sounds like a reasonable explanation in theory. Has it worked out that way in the real seasonal forecasting world, though? To check, I averaged Heidke skill scores (one way to grade the accuracy of a forecast-- see here) from 1995 to present for seasonal precipitation outlooks for the contiguous U.S.* during the peak of El Niño and La Niña (October-December through February-April) and compared them to the ENSO state. While these forecasts were not for extremes in precipitation, you would still expect a better forecast of above or below-normal precipitation given an ENSO event.
Skill scores for predicted precipitation were indeed higher during both El Niño and La Niña than they were for Neutral. This result is consistent with previous research that found seasonal rainfall forecasts are better during ENSO events and are often the best when ENSO events are stronger (Goddard and Dilley, 2005, Livezey and Timofeyeva, 2008, Barnston et al., 2010).
In the end, while you cannot blame everything on El Niño or La Niña, El Niños and La Niñas still provide forecasters with a better idea for where changes in impacts (extreme or not) will occur. A boon to forecasters who already have their work cut out for them deciphering our chaotic atmosphere.
*Updated June 26, 2015–Text was revised to clarify that the analysis covers outlooks for the contiguous United States.
References
Dai, A., I.Y. Fung, and A.D. Del Genio, 1997: Surface observed global land precipitation variations during 1900-88. J. Climate, 10, 2943-2962.
Mason, S. J., and L. Goddard, 2001: Probabilistic precipitation anomalies associated with ENSO. Bull. Amer. Meteor. Soc., 82, 619-638.
Goddard, Li., and M. Dilley, 2005: El Niño: Catastrophe or opportunity. J. Climate, 18, 651-665.
Livezey, R. E., and M. M. Timofeyeva, 2008: The first decade of long-lead U.S. seasonal forecasts— Insights from a skill analysis. Bull. Amer. Meteor. Soc., 89, 843-854
Barnston, A. G., S. Li., S. J. Mason, D. G. DeWitt, L. Goddard and X. Gong, 2010: Verification of the first 11 years of IRI’s seasonal climate forecasts. J. Appl. Meteor. Climatol, 49, 493-520.
Comments
Acronym
RE: Acronym
The SO in ENSO refers to the Southern Oscillation,which are the changes in the atmospheric circulation (specifically the sea level pressure across the Pacific ocean) that accompanies the changes in ocean temperature and makes ENSO a coupled ocean-atmosphere phenomena. For further details on the origin of the acronym, check out the very first ENSO blog post from May 2014:
http://www.climate.gov/news-features/blogs/enso/what-el-ni%C3%B1o%E2%80…
Short-term climate predictions and climate change
valore de ONI cambiaron?
RE: valore de ONI cambiaron?
The ONI values changed when the data set used to create the indices changed from ERSST version 3b to version 4. Changes to the underlying data sets occur from time to time, as new data or techniques are used to improve the data set. For the current event, since the values for SON 2014 and JFM 2015 decreased to 0.4, all of these values were changed back to black, as the historical definition was no longer met. However, the ONI is used as a simple way to classify historical ENSO episodes, which has its advantages and disadvantages. Weaker/shorter episodes in the record will always fluctuate during ERSST version and climatology updates. One can only recognize historical episodes (at least 5 consecutive overlapping season) retrospectively. In month-to-month updates, CPC does not rely on the ONI. We examine many indices to assess conditions. CPC began issuing El Nino advisories in March 2015, so according to NOAA, that is when this episode began and changes to the ONI index will not impact this.
Add new comment