2014 State of the Climate: Carbon Dioxide
Why carbon dioxide matters
Carbon dioxide is the primary greenhouse gas emitted through human activities. It absorbs heat (infrared energy) radiated from the surface and from the surrounding atmosphere, and then it releases some of it back toward Earth's surface. By burning fossil fuels for energy, human activities have increased the concentration of carbon dioxide in the atmosphere by more than 40% since the Industrial Revolution, causing global warming and making the pH of the ocean more acidic.
Conditions in 2014
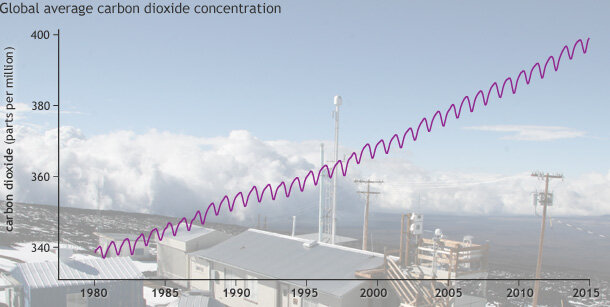
Global average carbon dioxide concentrations since 1980, with photo of Mauna Loa Observatory in background. Adapted from Figure 2.36 in State of the Climate in 2014.
On an annual average basis, carbon dioxide is a relatively well-mixed throughout the atmosphere, so there is little variation from place to place. The graph shows global average carbon dioxide concentration in parts per million since 1978. Using measurements taken worldwide, scientists estimated 2014 global average carbon dioxide concentration at 397.2 parts per million (ppm), an increase of 1.9 ppm over the 2013 global average. Monthly averaged carbon dioxide concentrations for April, May, and June all exceeded 400 ppm.
Scientists have monitored and analyzed levels of carbon dioxide in the atmosphere from the Mauna Loa Observatory in Hawai’i since 1968. In 2014, the annual average carbon dioxide concentration at Mauna Loa stood at 398.6 ppm—over a 25 percent increase compared to conditions at the start of the record.
While the annual global average inches closer to the 400 ppm threshold, scientists have noted other major milestones in recent years. On May 9, 2013, the daily average concentration of carbon dioxide in the atmosphere at Mauna Loa Observatory surpassed 400 ppm for the first time.
Change over time
Scientists attribute the growth of atmospheric carbon dioxide levels to a fourfold increase in emissions from human activities such as fossil fuel combustion and cement production.
The global growth rate of carbon dioxide has accelerated from about 0.6 ppm per year in the early 1960s to an average of 2 ppm per year during the past 10 years.
Since 1990, the annual increases have varied considerably from year to year, ranging from as little as 0.7 to as much as 2.8 ppm per year. This variability can largely be attributed to the El Niño–Southern Oscillation (ENSO), an oscillating warming and cooling pattern in the central and eastern tropical Pacific Ocean. Beyond impacting global weather patterns, the different phases of ENSO can have a large impact on the natural exchange of carbon dioxide between land, ocean, and atmosphere.
For example, shifts in temperature and precipitation patterns during El Niño and La Niña years can drive regional changes in water availability, which is key for plants. Plants play a major role in the global carbon cycle by absorbing carbon dioxide for their life processes. One study found that El Niño years are associated with low net primary productivity—the amount of carbon dioxide taken up by plants during photosynthesis—and higher levels of carbon dioxide in the atmosphere.
References
Bastos, A., S. W. Running, C. Gouveia, and R. M. Trigo (2013), The global NPP dependence on ENSO: La Niña and the extraordinary year of 2011, J. Geophys. Res. Biogeosci., 118, 1247-1255. doi:10.1002/jgrg.20100.
Dlugokencky, E. J., B. D. Hall, S. A. Montzka, G. Dutton, J. Mühle, and J. W. Elkins, 2014: [Atmospheric chemical composition] Long-lived greenhouse gases [in “State of Climate in 2014”]. Bulletin of the American Meteorological Society (BAMS), S39-S40.
Melillo, Jerry M., Terese (T.C.) Richmond, and Gary W. Yohe, Eds., 2014: Climate Change Impacts in the United States: The Third National Climate Assessment. U.S. Global Change Research Program, 841 pp. doi:10.7930/J0Z31WJ2.