The 100-Hour Snowstorm of February 1969
Most people in the East who remember historical snowstorms consider the March 1993 “Storm of the Century” to be the biggest snowstorm to ever affect that part of the country. It’s no wonder: 270 people were killed in the U.S., damages were in the neighborhood of $5.5 billion, every major airport on the east coast was shut down, and most interstates north of Atlanta were closed.
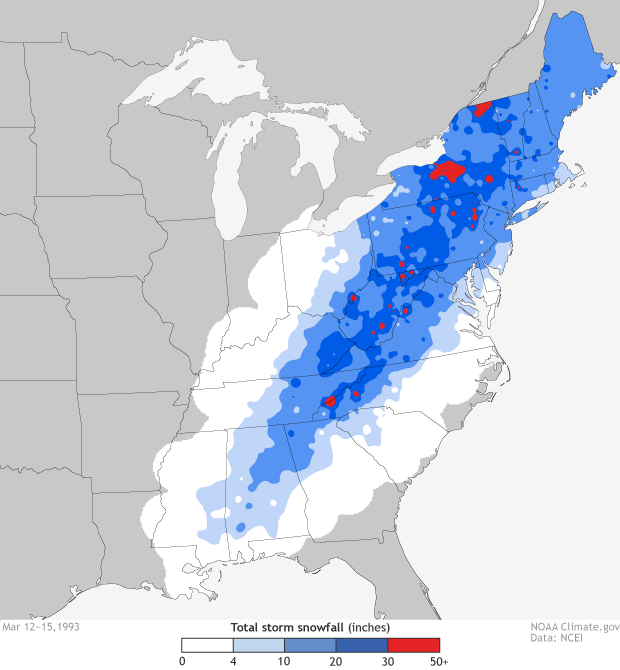
Snowfall amounts for the "Storm of the Century," which walloped the East Coast between March 12-15, 1993. Map by NOAA Climate.gov, based on data provided by Mike Squires, NCEI.
Using our Regional Snowfall Index (RSI), the March 12-15, 1993, event had a raw score of 22.12, making it a Category 5 storm. Yet when we look at the ranking of all historical Northeast snowstorms, the “Storm of the Century” only finishes in second place. No way! How can that be?
Trying to be objective about snow
To answer that question, we need to give a brief description of the RSI and how it ranks snowstorms. NOAA’s National Centers for Environmental Information (NCEI) has received numerous requests to provide an index that objectively ranks snowstorms within different regions of the country. Because of the many and varied ways snowstorms disrupt people’s lives, this is a difficult challenge. The impacts of a storm are often complicated and hard to quantify. For example, a small but poorly forecast storm that strikes at rush hour has much more impact than a large well-forecast storm that strikes during a weekend.
There are many plausible ways one could measure societal impacts from a storm, so when it comes to rankings, the most important thing is that you come up with a reasonable method and then use it consistently. Scientists at NCEI and Rutgers University developed RSI which is based on the area of snowfall accumulation, the amount of snowfall, and—critically—population. By including population, we are taking into account how the event affected people’s lives.
The RSI value for a specific region is based on snowfall and population information from within that region. So, for example, in the Northeast RSI uses thresholds of 4”, 10”, 20”, and 30.” In the Southeast the thresholds are 2”, 5”, 10”, and 15.” That way, the index takes into consideration that different parts of the country have different expectations of what is considered heavy snow.
The population density in the 6 eastern regions used by the RSI is shown in the map below. It is obvious that there is a wide range of population density across the six regions where RSI is calculated. The RSI is designed to account for this.
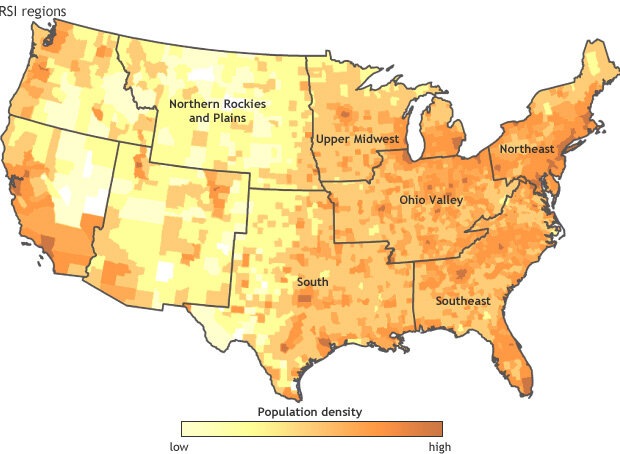
The Regional Snowfall Index uses region-specific snowfall thresholds that are based on the climatological range of snowfall within 6 U.S. regions. The final calculation takes into consideration population density and the area affected by snowfall of increasing amounts. Map by Mike Squires, NCEI.
RSI values range from near zero to about 35. However these raw values are converted to categorical values between 0 and 5, similar to the Fujita scale for tornadoes or the Saffir-Simpson scale for hurricanes. NCEI has generated RSI for over 600 snowstorms since 1900.
So if the devastating March 1993 snowstorm is not the top ranked RSI storm, which is? The top ranked RSI storm for the Northeast region is the February 22-28, 1969 storm. It has an RSI score of 34.03 making it a Category 5 storm (see map below). This surprises many people because unless you are over 55 and lived in Massachusetts, New Hampshire, or Maine in 1969, you have probably never heard of this storm.
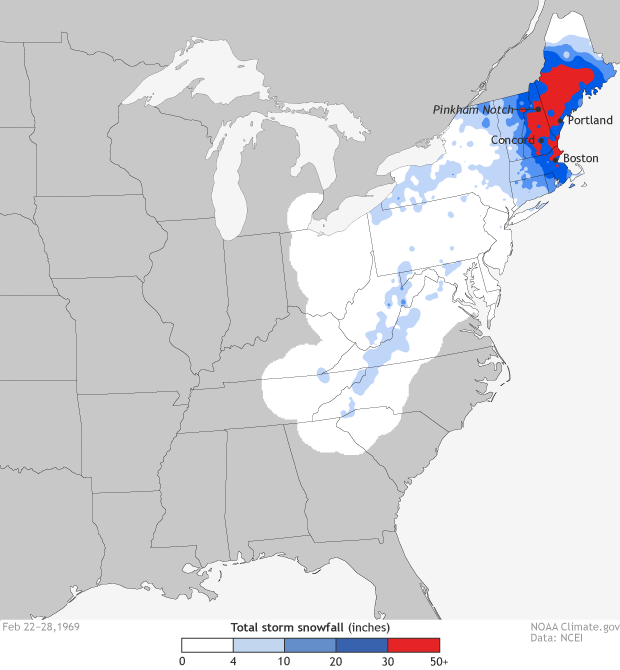
Snowfall amounts for the "100-Hour Snowstorm of 1969, which put down more than 30 inches of snow across a large part of the Northeast. Map by NOAA Climate.gov, based on data provided by Mike Squires, NCEI.
Snow measured in feet
The 1969 storm has some impressive snowfall totals. Normally, snowfall in this country is measured in inches. Mt. Washington in New Hampshire had over 8 feet of snow during the storm. On February 25 alone, Mt. Washington had over 4 feet of snow: 49.3 inches, which is still the one-day record. That contributed to the February 1969 monthly total of 172.8 inches (over 14 feet), which is still their monthly record.
The map shows the widespread area of snowfall in excess of 30.” Pinkham Notch had 77,” Boston 26.3,” Portland, ME, 26.9,” and Concord, NH had 28.0” of snowfall. The primary reason for the high snowfall totals was that the storm causing all of this havoc was very slow moving, allowing snow to accumulate to these record and near-record amounts. Most of the accumulating snow in Massachusetts, New Hampshire, and Maine fell on the four days from 24 through 27 February. Hence this storm is sometimes known as the “100-Hour Snowstorm of February 1969.”
One-two punch: area and population
Well, those totals are all very impressive, but how did the “100-Hour Snowstorm” get a higher RSI score than the “Storm of the Century”? The tables below, which contain RSI scores as well as area and population information for the top 5 storms, give us the answer. Looking at the first table in the “snowfall over 30 inches” column, the February 1969 storm had an area 4.5 times larger than the March 1993 storm (16,192 vs. 3,574 square miles). This large extent is also illustrated by the large red area in the 1969 map.
| Start date | RSI score | Category | Area > 4" | Area > 10" | Area > 20" | Area > 30" |
|
2/22/1969 |
34.026 |
5 |
84,173 |
48,098 |
33,673 |
16,192 |
|
3/12/1993 |
22.117 |
5 |
172,893 |
163,379 |
51,490 |
3,574 |
|
1/6/1996 |
21.708 |
5 |
94,379 |
71,056 |
31,549 |
1,172 |
|
1/22/2016 |
20.138 |
5 |
69,441 |
39,929 |
19,200 |
1,220 |
|
2/4/1978 |
18.422 |
5 |
159,554 |
106,190 |
18,528 |
1,249 |
Comparison of total area in square miles affected by increasing amounts of snowfall for the top five RSI-ranked snowstorms since 1900. The area affected by 30 or more inches of snow during the 1969 storm was more than 4 times the size of the second-ranked storm, the 1993 "Storm of the Century."
Second, looking at the population affected by snowfall over 30” in the second table, the February 1969 storm also affected 4.5 times as many people then the March 1993 storm. When looking at other Northeastern snowstorms back to 1900, the area and amount of people affected by 30” and greater snowfall during the February 1969 event is truly historic, exceeding by far any other storm during that period.
| Start date | RSI score | Category | Population > 4" | Population > 10" | Population > 20" | Population > 30" |
|
2/22/1969 |
34.026 |
5 |
18,688,150 |
10,586,430 |
7,694,970 |
2,009,520 |
|
3/12/1993 |
22.117 |
5 |
58,527,053 |
52,584,503 |
7,921,803 |
729,753 |
|
1/6/1996 |
21.708 |
5 |
51,773,528 |
48,730,978 |
28,928,278 |
493,778 |
|
1/22/2016 |
20.138 |
5 |
47,293,970 |
35,036,764 |
21,000,936 |
1,121,182 |
|
2/4/1978 |
18.422 |
5 |
55,125,790 |
46,055,280 |
9,394,980 |
1,169,430 |
Comparison of total population affected by increasing amounts of snowfall for the top five RSI-ranked Category 5 snowstorms since 1900. Although the 1993 "Storm of the Century" affected a larger total population with at least 4 inches of snow, the 1969 "100-Hour Snowstorm" brought 30 or more inches of snow to nearly 3 times as many people.
One of the reasons that this storm is not as well-known as others despite its impressive stats is that much of the 30”+ snowfall was away from the crowded Northeast Corridor. Actually if one Googles “February 1969 Snowstorm,” most of the information that returns refers to the February 8-10, 1969 storm.
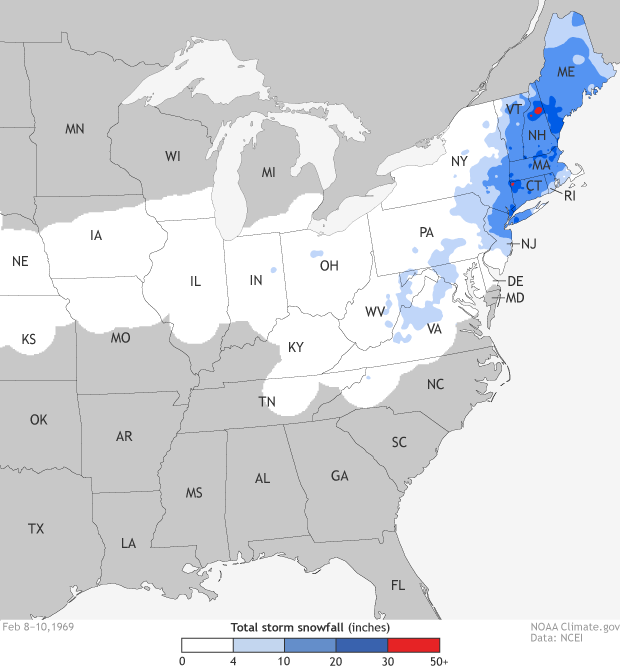
Snowfall amounts for a Category 2 storm that also hit the Northeast in February 1969. Map by NOAA Climate.gov, based on data provided by Mike Squires, NCEI.
This storm was ranked Category 2 by RSI. Keep in mind, an RSI Category 2 snowstorm is still a significant event that causes great hardships on society. Notice the large area of this storm that received over 10” of snow with some 20” snow in New York City. The city was ill-prepared for the storm: almost 40% of the city’s snow removal equipment was out for maintenance. Transportation was almost at a complete halt for two days and many streets were not plowed for a week.
This storm is often referred to the as the “Lindsay Storm,” referring to then-Mayor John Lindsay of New York City. The uproar over Lindsay’s handling of the crisis led to him losing his party’s primary for mayor. However, he ran as an independent in the general election and was able to maintain his position as mayor.
So there you have it. The RSI is designed to quantify societal impacts at a regional scale (several states – like the Northeast). It differentiates impacts between regions; 4” of snow in the South is not the same as 4” in the Northeast. RSI uses population as a stand-in for all the complicated interactions that happen at local scales during a snowstorm. Finally, RSI is objective. The methodology is based on peer-reviewed assumptions and methodology.
While the February 22-28, 1969, snowstorm is not as well known as the March 1993 “Storm of the Century,” it affected many more people with heavy snow (greater than 30”) than any other storm since 1900. The RSI allows us to give the storm the respect it deserves.