Earlier this year, Cape Town braced for Day Zero. That would be the day that South Africa's second-largest city turned off its taps and sent its 4 million residents to water-collection points for no more than 25 liters (7 gallons) per person per day. When Climate.gov last checked in, Day Zero was scheduled for early May 2018, but Day Zero now been deferred to 2019.
One factor contributing to Day Zero's deferral was slightly more favorable rainfall. These maps show precipitation as a percentage of the 1961–1990 baseline, with below-normal amounts in shades of brown, and above-normal amounts in shades of blue-green.
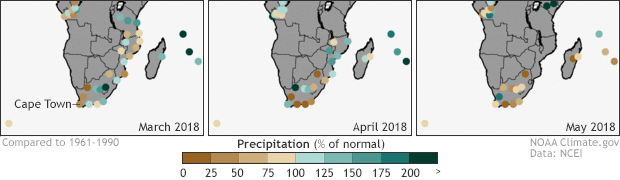
Low precipitation amounts appear in shades of brown. Higher amounts appear in shades of blue-green.
Most of South Africa gets the majority of its rainfall from December through February—start of the Southern Hemisphere summer and the South African Monsoon. Located along the coast, Cape Town experiences different precipitation patterns, typically collecting most of its annual rain from June through August. With that said, rain can still fall during the Southern Hemisphere autumn. March 2018 precipitation in Cape Town was below normal, but April precipitation was above average, and May precipitation was near normal.
The Climate System Analysis Group at the University of Cape Town offers, with caveats, rainfall data from locations around the city. Data from one such Cape Town rainfall station, with records dating back to 1999, appears here.
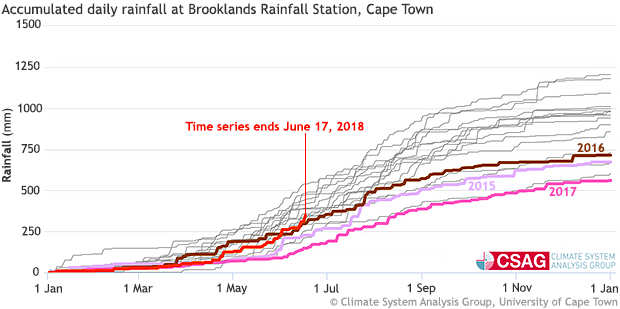
For 2015 through June 2018, rainfall amounts are color coded by year. Earlier years are gray.
This graph shows accumulated daily rainfall throughout the calendar year, with data highlighted for January 1, 2015, through June 17, 2018. (Prior years are all gray.) Rainfall in 2017 (pink) was the lowest on record through almost the entire year, and 2015 (lavender) and 2016 (red-brown) were not much better. Though it remained very low through the first few months of the year, 2018 rainfall (red) began to pick up in May.
Though better than previous years, May 2018 rainfall in Cape Town was still low. Slightly improved precipitation wasn't the only factor in Day Zero's deferral. Cape Town also benefited from aggressive water-conservation efforts. Faced with the prospect of no tap water, Capetonians recycled shower and washing machine water, and limited toilet flushes to once a day, The Guardian reports. Water use remains limited to 50 liters (13 gallons) per day, and although it's been pushed further back, Day Zero hasn't disappeared from the horizon.
References
Climate Systems Analysis Group. Current season's rainfall in Cape Town. University of Cape Town. Accessed June 22, 2018.
Mahr, K. (2018, May 4). How Cape Town was saved from running out of water. The Guardian. Accessed June 22, 2018.
Water Dashboard. City of Cape Town. Accessed June 22, 2018.