U.S. sees average precipitation and slightly above-average temperature in October 2020
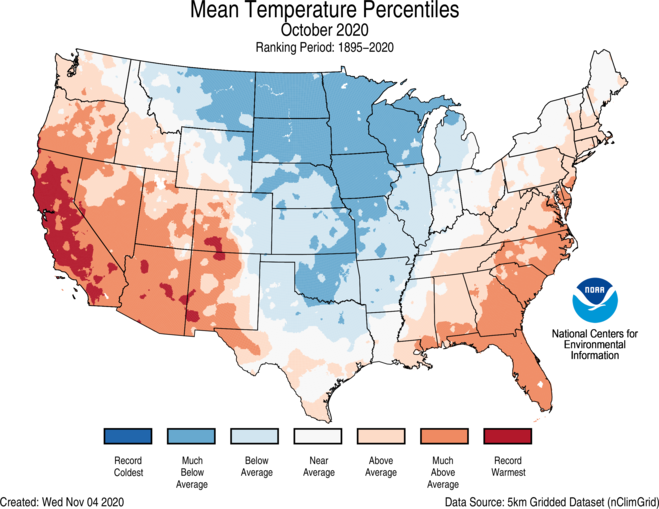
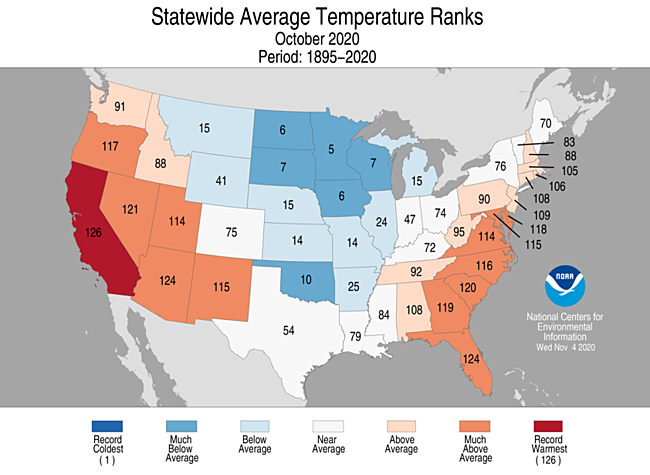
Above-average temperatures dominated the U.S. West in October 2020, as well as the central Gulf Coast and the East Coast. California ranked warmest on record for October while Arizona and Florida both ranked third warmest. Below-average temperatures were observed from the Northern Rockies to the Great Lakes and southward to the Southern Plains. North Dakota, South Dakota, Minnesota, Iowa, Wisconsin and Oklahoma ranked among their 10 coldest Octobers on record.
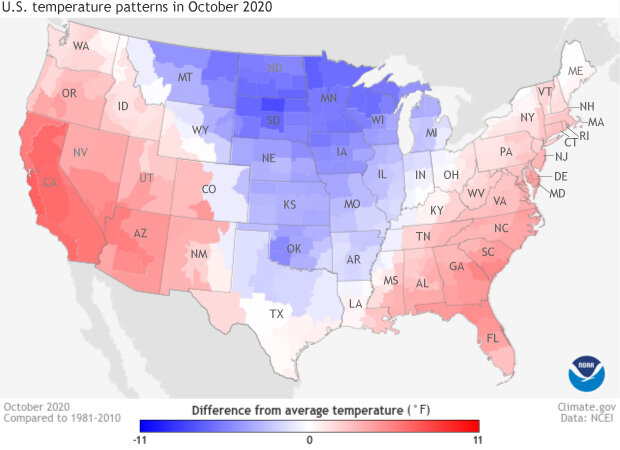
Temperatures across the contiguous United States in October 2020 compared to the 1981-2020 average. Red areas were up to 11° Fahrenheit above average; blue areas were up to 11° F below average. Map from Data Snapshots on Climate.gov, based on data from NOAA National Centers for Environmental Information.
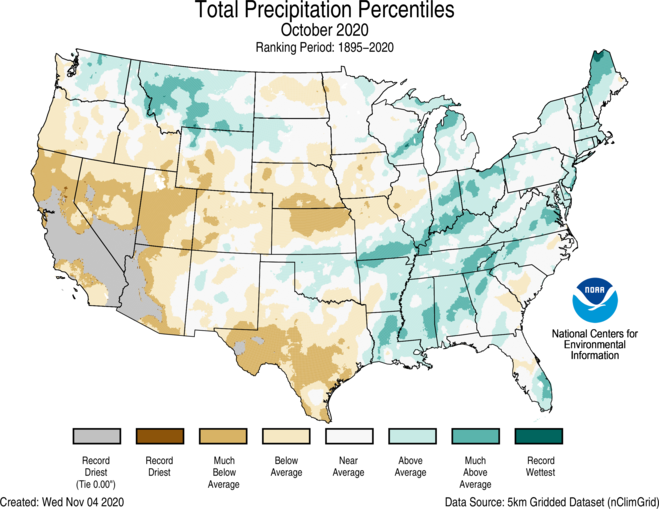
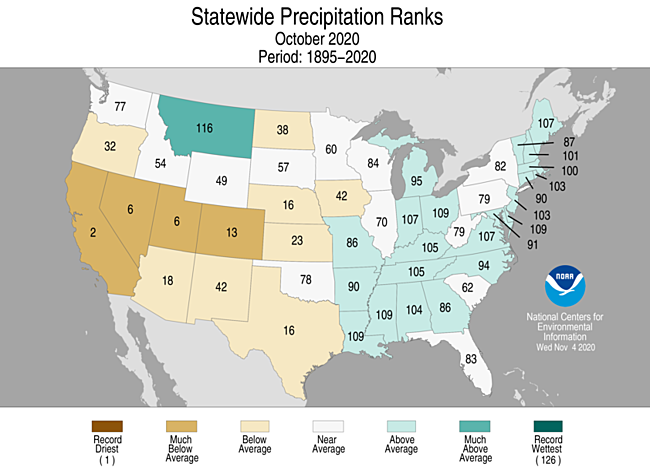
Below-average precipitation was observed across much of the western U.S., the Deep South, central and northern Plains as well as across portions of the Southeast. California ranked second driest on record for October. Nevada and Utah both ranked sixth-driest October on record. Above-average precipitation occurred across portions of the northern Rockies, Great Lakes, middle and lower Mississippi Valley, Ohio Valley, Northeast and parts of the Southeast.Record daily and monthly snowfall were reported across portions of the West and Plains during the last week of October.
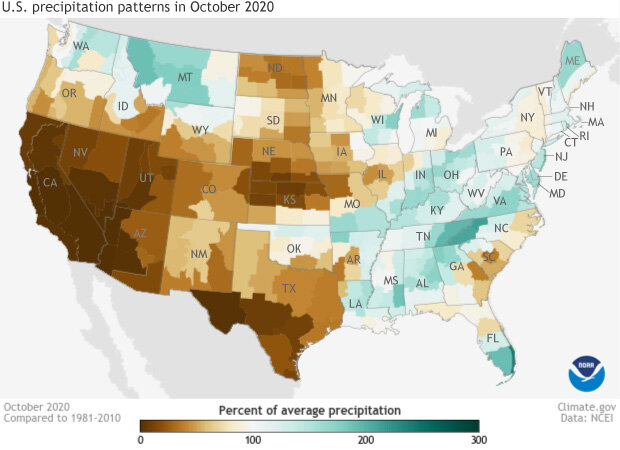
U.S. precipitation in October 2020 compared to the 1981-2010 average, with places that les than 100 percent of normal in brown, and places that were more than 100 percent of normal in green. Data Snapshots map by Climate.gov, based on data from NOAA NCEI.
According to the November 3 U.S. Drought Monitor report, approximately 45 percent of the contiguous U.S. was in drought, up slightly from 42.6 percent at the end of September. Drought conditions intensified across the Four Corners region as well as parts of the northern and central Plains. Drought coverage became less severe across portions of the Northeast. Drought also expanded across Hawaii.
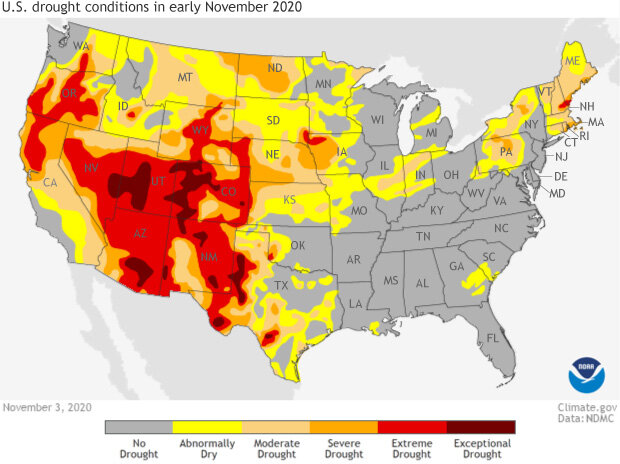
Drought status across the Lower 48 states as of November 3, 2020. Across most of hte country, conditions range from abnormally dry (yellow) to various stages of drought, including large areas of extreme (red) and even some exceptional (dark red) drought in the U.S. Southwest. Data Snapshots map by Climate.gov, based on data from the U.S. Drought Monitor Project.
To see more details on U.S. climate conditions in October 2020, see the monthly summary from NOAA's National Centers for Environmental Information. To see the outlook for November climate conditions, see our previous post. To see what future October temperatures could be like in the U.S. if the world continues to follow a pathway with large emissions of greenhouse gases, check out this animated gif of results from one suite of climate model projections. To investigate what these changes could mean for local extremes in temperature and precipitation, visit the U.S. Climate Explorer, part of the U.S. Climate Resilience Toolkit.