After reaching a record-low summer minimum earlier this year, Antarctic sea ice continues to break records. In the midst of its winter growth phase, it has reached a record-low extent, far below the previous record, for this time of year.
Data archived by the National Snow and Ice Data Center (NSIDC) record Antarctic sea ice extent at 4.5 million square miles (11.7 million square kilometers) as of June 27, 2023. That’s nearly a million square miles (2.6 million square kilometers) below the 1981–2010 average, and approaching a half a million square miles (1.2 million square kilometers) below the previous lowest extent for the day, observed in 2022.
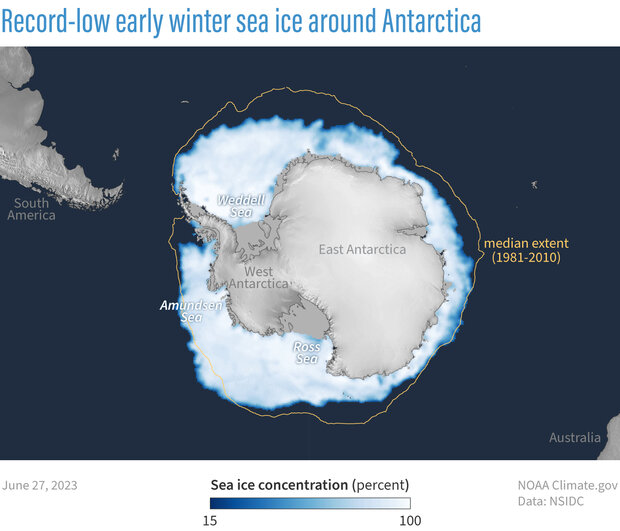
Adapted from NSIDC’s Sea Ice Index, this map shows sea ice concentration on June 27, 2023. Concentration is color coded, with white representing solid ice and dark blue representing open ocean. For reference, this map includes the median ice edge for 1981–2010: half of the years had smaller extents, and half had larger on this date. Map by NOAA Climate.gov, based on data from NSIDC.
Comparing late June 2023 sea ice concentration to the median ice edge for the same time of year shows below-average sea ice concentrations around nearly the entirety of the continent. Only in parts of the northern Amundsen Sea near West Antarctica does sea ice spill over the long-term median ice edge.
While a map provides a snapshot in time of sea ice conditions, a time series provides even more context. Every year, in both the Northern and Southern Hemispheres, sea ice grows and shrinks with the seasons. Tracking sea ice extent throughout the year yields an S-curved line. Comparing yearly extent lines to each other shows where one year is substantially different—and 2023 is such a year.
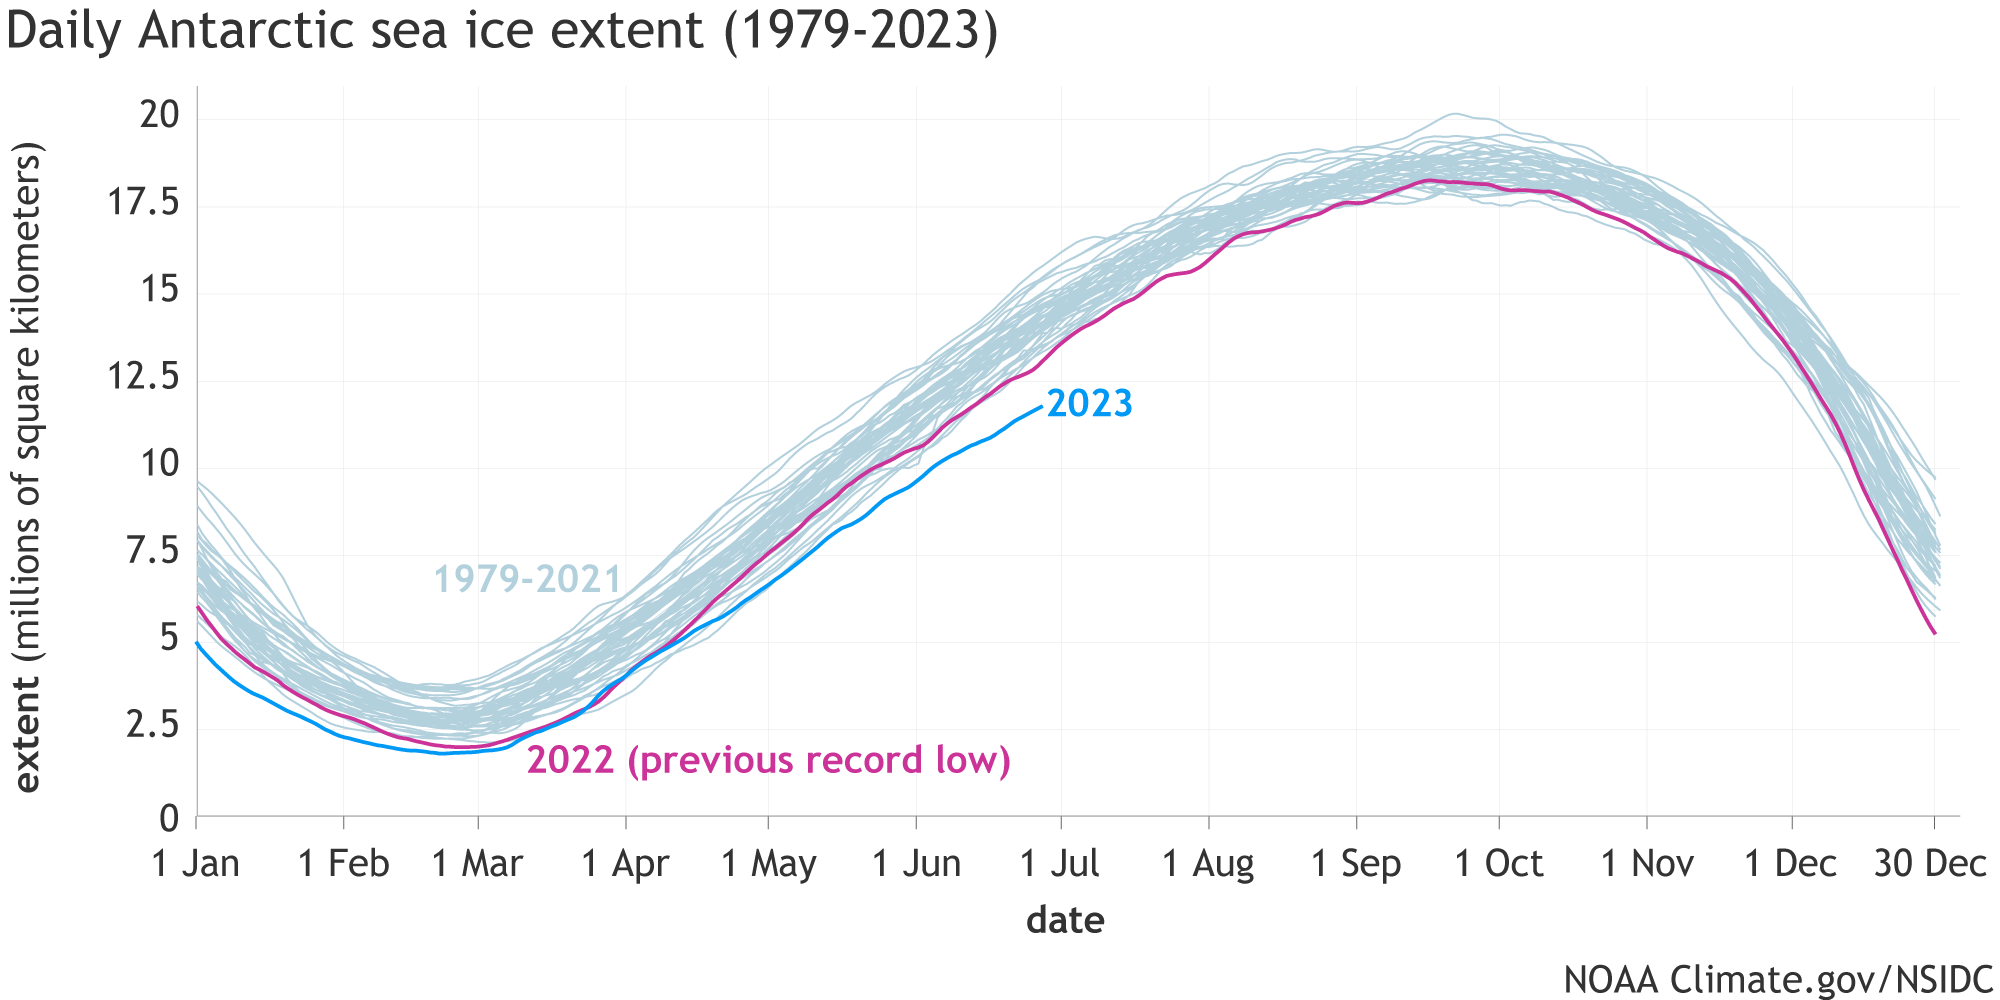
Derived from NSIDC’s Charctic Interactive Sea Ice Graph, this graph shows daily Antarctic sea ice extent—the area of the Southern Ocean with at least 15 percent sea ice concentration—across the satellite record from 1979-2023. Ice extent in 2023 (bright blue) was slightly smaller than the previous record low (2022, shown in magenta) at the summer minimum in February, but much smaller in late June, the start of the winter ice growth season. All other years in the satellite record (1979–2021) are light gray-blue. Graph by NOAA Climate.gov/NSIDC.
Antarctic sea ice extent for June 27, 2023, fell below the previous record low for this date by nearly twice the size of Texas. It fell below the 1981–2010 average for this date by nearly four times the size of Texas.
Sea ice behavior varies from day to day and year to year for a variety of reasons, and deviations from the long-term average, even substantial ones, have been observed before. Compared to the Arctic, Antarctic sea ice exhibits a greater range of maximum and minimum annual extents, due largely to geographic differences between the two regions. Even so, the current low Antarctic sea ice extent is unusual.
In contrast to the Arctic, which has shown a decades-long decline in sea ice extent, the Antarctic has not exhibited a significant long-term trend. As recently as 2014, Antarctic sea ice racked up an all-time-high winter maximum extent. Starting in 2016, however, Antarctic sea ice extents have fallen mostly below the 1981–2010 average, and 2023 extents have set daily record lows since April, even below extents from the previous record holder, 2022. Antarctic sea ice’s current extraordinary behavior raises the question of whether this could be the start of a longer-term trend related to climate or ocean changes, but answering that question will require more time, data, and research.