Missouri River Flood Drama Likely Took Direction from La Niña
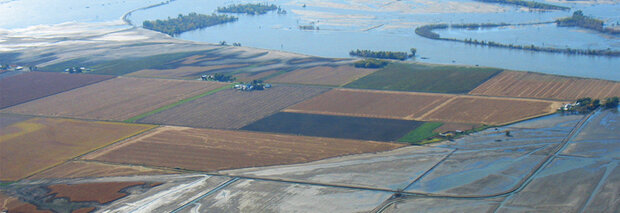
Islands of trees were stranded in the flooded Missouri River (top) west of Rockport, Missouri, on October 2, 2011, while farmland remained underwater (bottom right). Photo © Lee Valley, Inc.
|
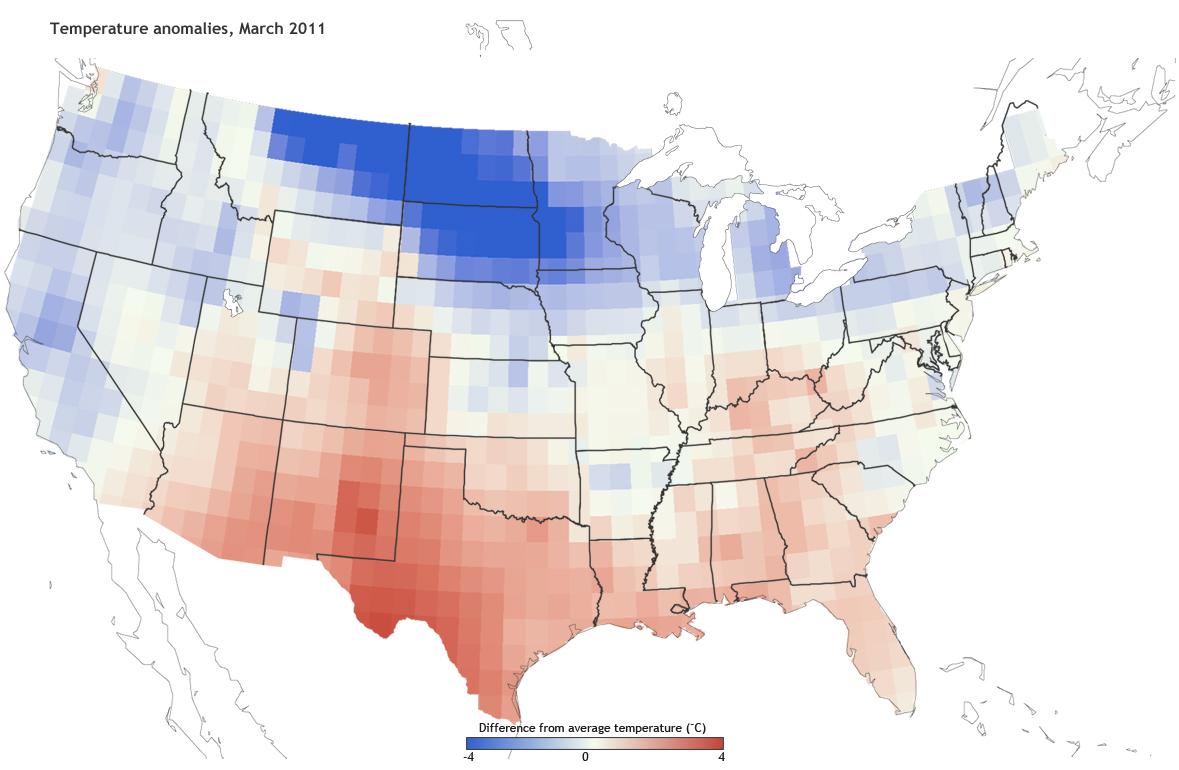
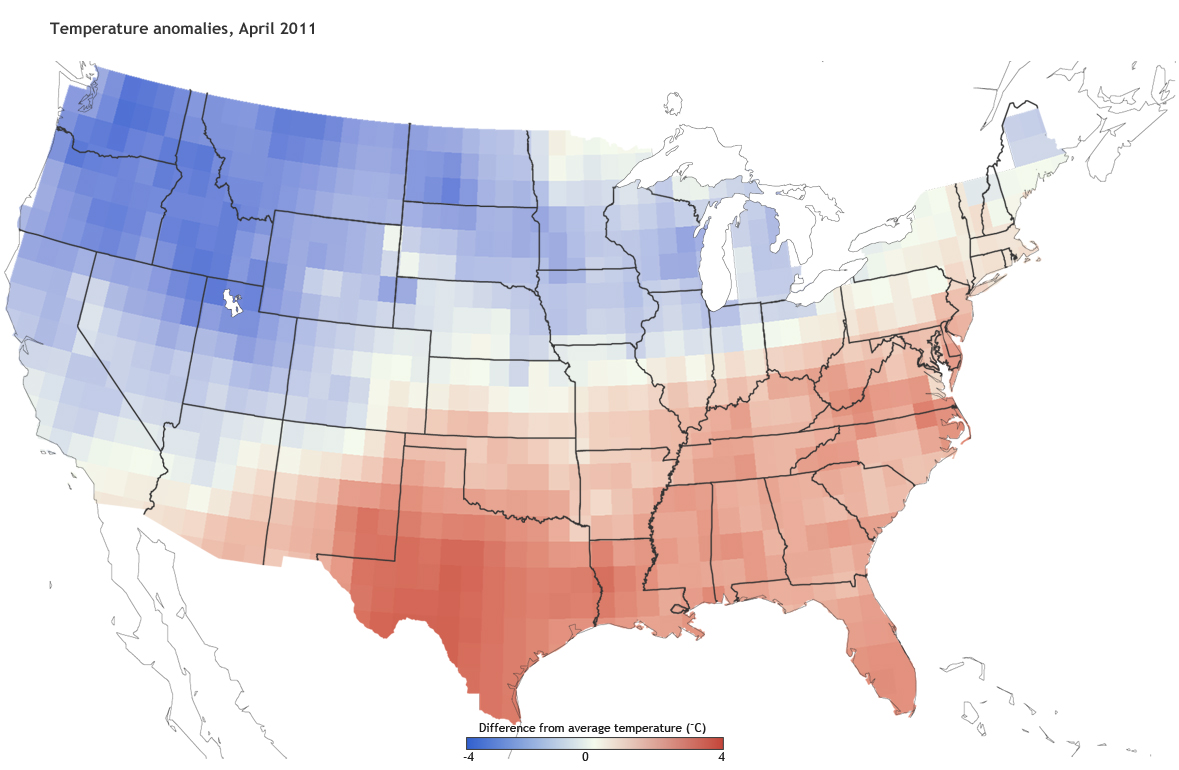
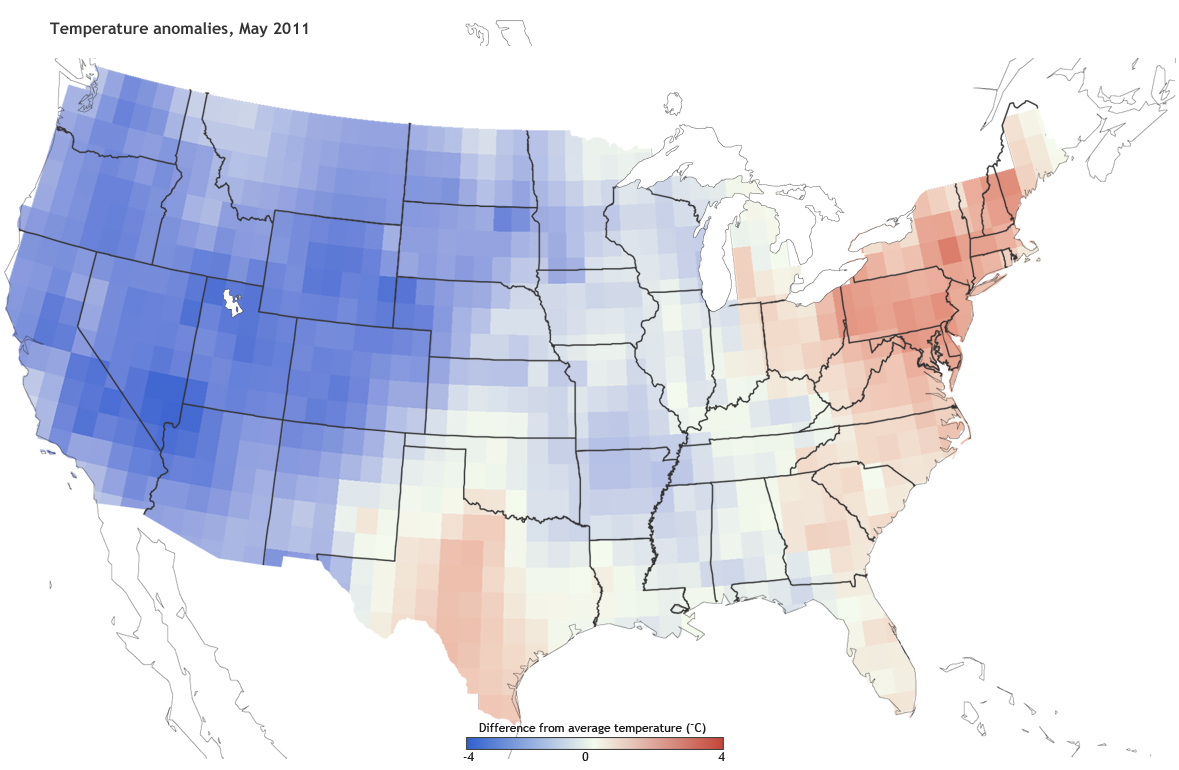
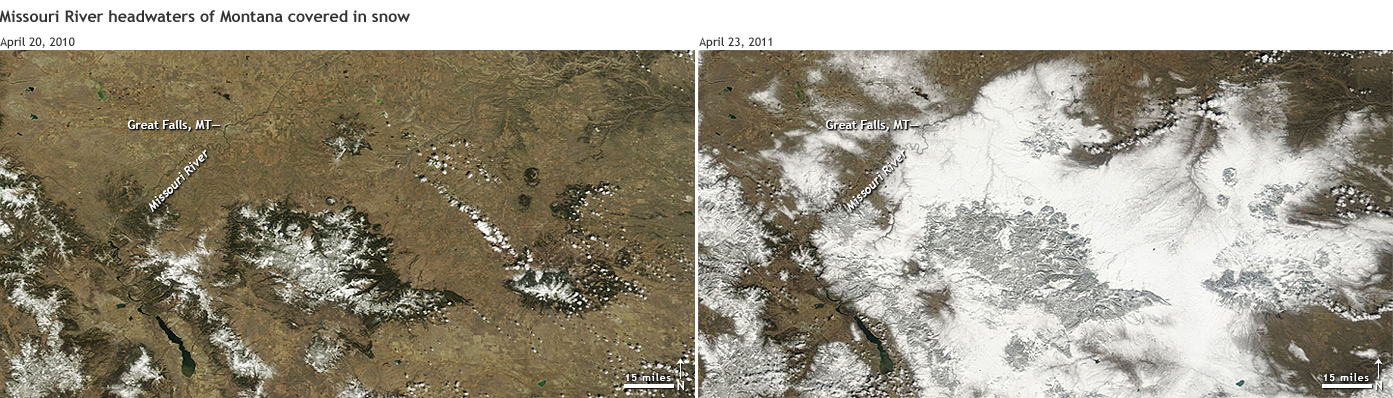
The Missouri is the continent's longest river. It trickles out of the mountains in Montana and flows east and south toward the Mississippi. Its waters are essential to the basin's farmers and ranchers, who raise 46% of the wheat, 22% of the corn, and 34% of the cattle in the United States. The river is also home to a system of dams, levees, and spillways meant to insulate people living in the basin from the river's extremes. But in 2011, they couldn't keep the Missouri completely under control. Beginning in late spring and continuing through the summer, floodwater spilled over the Missouri's banks into fields and towns, reaching up to five miles from the river's normal edge. The waters finally started to recede this fall, giving the basin's residents their first glimpse at the $2 billion or more in damages from this slow-moving catastrophe. The Actors A large swath of territory in Montana, North Dakota, and South Dakota also experienced unusually cold temperatures from March through May. This caused snow to linger on the ground longer than usual at low elevations. |
|
|
|
|
"Usually when someone talks about snowpack in the basin, we assume they're talking about mountain snowpack," said Jesse Aber, of Montana's Department of Natural Resources and Conservation. "This year we had two snowpacks: we had mountain and prairie." |
|
|
|
|
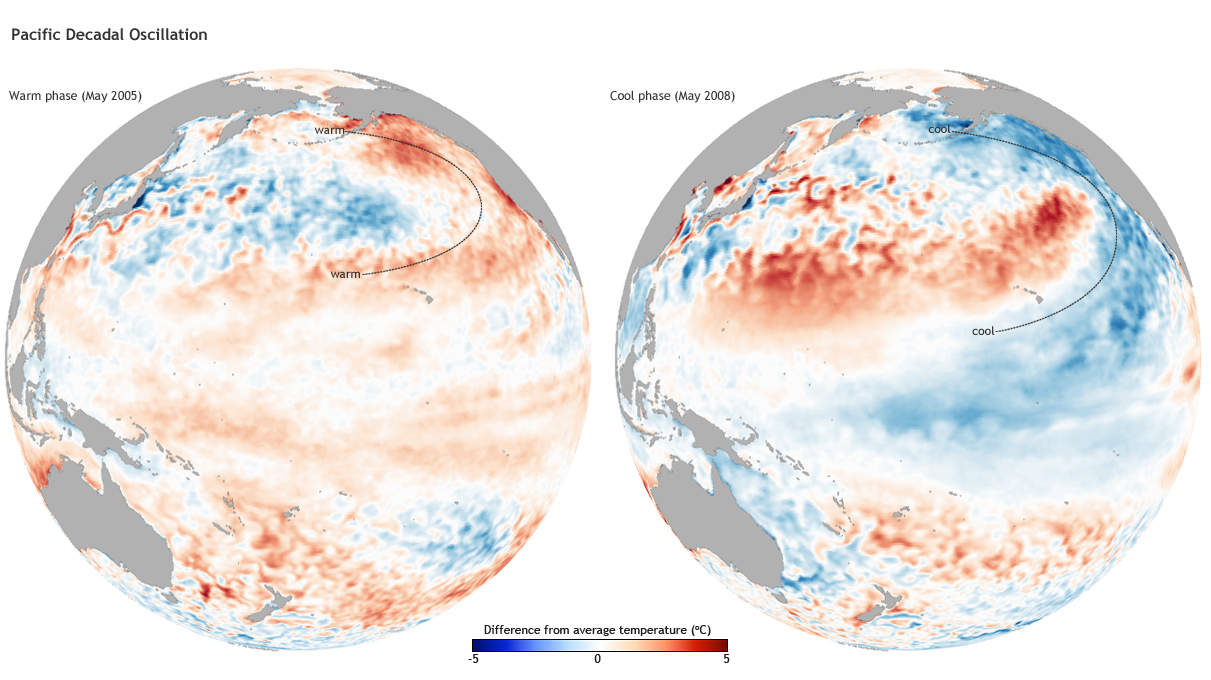
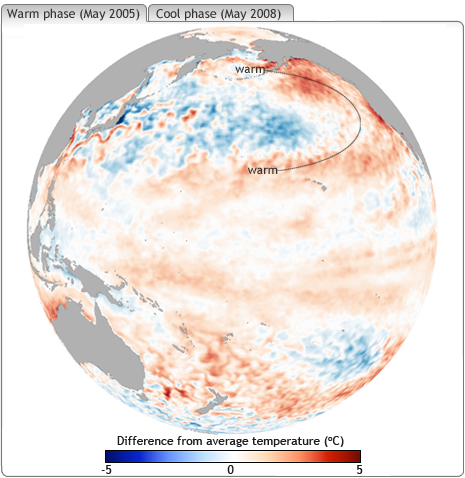
Not only did the snow linger longer than usual, there was more of it than usual. As of May 1, areas around the headwaters of the river had anywhere from 130% to more than 180% of the average annual snowpack on the ground compared to the period from 1971-2000. And then came the rain. The Story UnfoldsThe curtain for the flood rose the second week of May, when a storm brought up to five inches of rain to parts of Montana and Wyoming. The next week, four to seven inches fell across most of the region. In contrast, some of those areas see just 9-14 inches of rain all year on average. 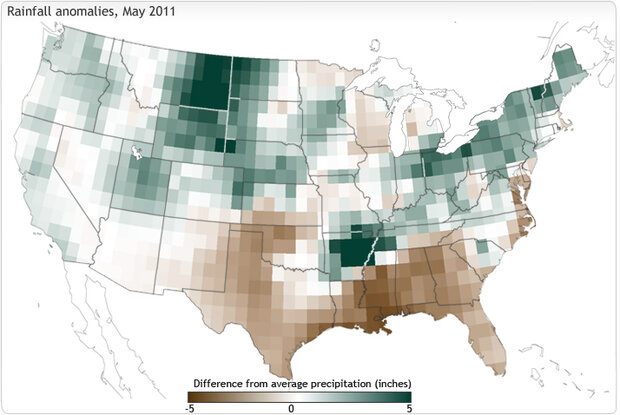 In May 2011, some parts of Montana received an average year’s worth of rain in a few weeks. Rainfall totals were several inches above average in the eastern part of the state (dark green). Data from NOAA’s Climate Prediction Center. The heavy spring rain combined with melting snow to produce runoff that turned the Missouri into a torrent. On average, the Missouri River channels 24.8 million acre feet of water per year. This year, it carried 24.3 million acre feet in May and June alone. 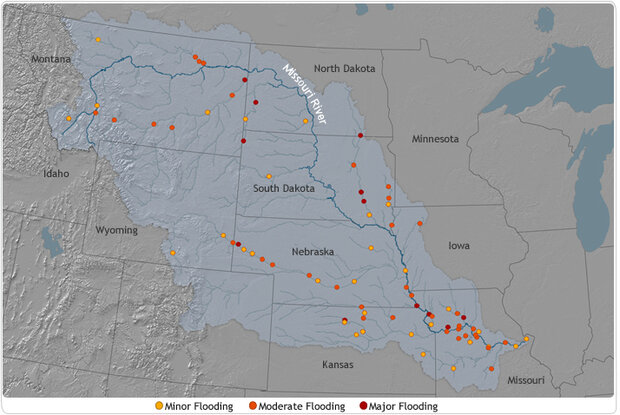 Dozens of locations along the main stem of the Missouri River and its tributaries were in flood stage on May 26, 2011. Yellow is minor, orange is moderate, and red is major flooding. Data from NOAA/NWS Missouri River Basin River Forecast Center. As the water rushed downstream and overtopped levees, fields along the river disappeared underwater. A number of farmers had already planted crops in April, according to John Wilson of the University of Nebraska-Lincoln Extension office in Burt County, Nebraska. In Burt County, 20,000 acres of farmland were directly affected by flooding. "We had some areas that when the floodwaters receded, you could still pick out the old planting rows; not much had happened," Wilson said. "We had other areas where the river tried to revert back to an old channel. One place in particular has a new channel through it that's probably 30-40 feet deep and a mile long." 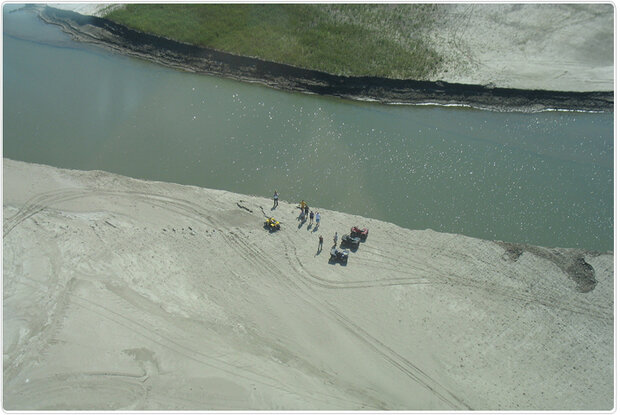 A half mile from the Missouri River, the flood carved a deep channel through Scott Olson’s Nebraska soybean field. On September 10, 2011, Olson’s brother and family viewed the remnants of the crop and the surrounding land, which has been scoured of top soil. Photo © Lee Valley, Inc. The flood buried some fields in up to 15 feet of sediment and sand. Wilson also says flooded fields have seen a decrease in mycorrhiza, a soil fungus that aids nutrient uptake in plants. On the other side of the river in Iowa, farmers have seen similar problems. Tim Johnson, a research analyst at the Iowa Farm Bureau, said certain areas might not be plantable again for a long time. "When you've got areas near levees that have been breached, they have been so scoured that you've lost a lot of your topsoil." That topsoil is what makes the basin such a fertile growing region. In total, the National Climatic Data Center estimates at least $2 billion in losses across the basin this summer, according to the preliminary Billion Dollar Disasters Report for 2011. Those estimates are likely to rise as the floodwaters continue to recede and the damage to buildings, roads, and infrastructure is fully revealed. The DirectorsWhile conditions on the ground caused the flood, there were directors behind the scenes giving the actors their cues. According to an analysis led by Dr. Robert Webb of the NOAA’s Earth System Research Laboratory about the climate causes of the floods, La Niña was most likely one of the directors. La Niña is a periodic cooling of waters in the eastern tropical Pacific. The cool waters are accompanied by stronger-than-usual easterly trade winds. These changes affect seasonal climate in places far “downstream” of the Pacific. During La Niña events, the polar jet stream tends to shift northward in a region stretching from the Pacific Ocean to the western United States, and then dips southward into the Missouri River Basin, bringing colder air into the region. 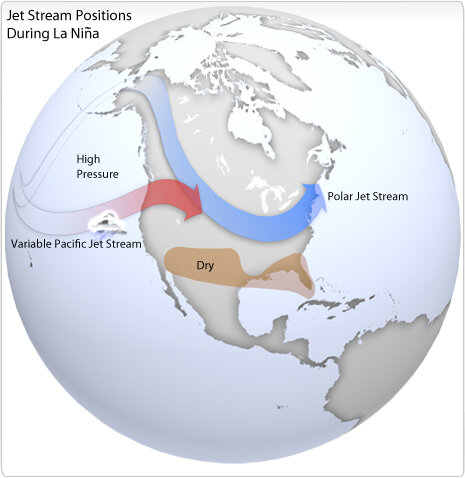 The jet streams are high-altitude, racing rivers of air that can influence the path of storms as they track over North America from the Pacific Ocean. The jet streams meander and shift from day to day, but during La Niña events, they tend to follow paths that bring cold air and storms into the Upper Missouri River Basin. Map based on original graphics from NOAA’s Climate Prediction Center. Historically, the result of these disturbances is that La Niña tends to tilt the odds towards colder-than-normal winter and spring temperatures across the upper Missouri River Basin, and snow cover and depth tend to be more extensive. This past winter and early spring, the climate followed that pattern. 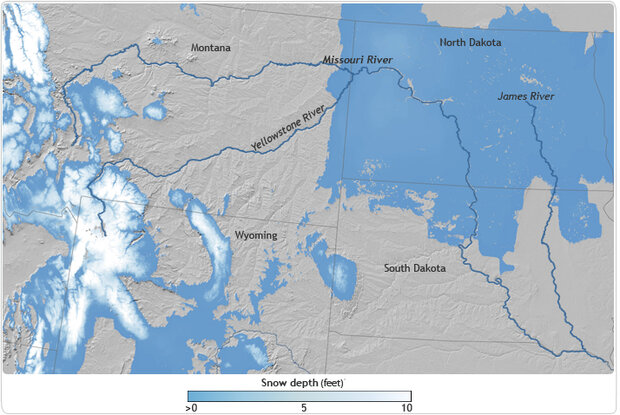 On May 1, 2011, deep snow (pale blue and white) in the mountains that feed the Missouri and Yellowstone Rivers was accompanied by lingering late spring snow at lower elevations (darker blue), including the James River headwaters in North Dakota. Snow data from the National Snow and Ice Data Center. The heavy rains in May probably aren’t part of the La Niña story, however, according to Dr. Martin Hoerling of NOAA’s Earth System Research Laboratory. For one thing, La Niña was petering out that month. In addition, La Niña’s biggest influence on climate occurs in winter; its influence is weaker in the spring. “From historical data [of past La Niña episodes], you cannot reconcile the spring 2011 wetness with a La Niña impact,” said Hoerling. In a description of the record rainfall in Montana, the Billings National Weather Service Office website notes, “Certainly, one or two of these especially wet systems are not uncommon during the month of May.” In May 2011, however, a persistent “block” of high pressure sat over western Canada. Like a boulder in a river, this mass of air guided the two storms from the Pacific straight over the Missouri River Basin, where they tapped into moisture coming up from the Gulf of Mexico. The downpours were extreme, but extreme weather doesn’t always require a special explanation. As Hoerling puts it: “Weather happens, and extremes and records are meant to be broken from time to time.” The Next ActIn the wake of this summer's disaster, Congress is holding hearings on river management strategies and the status of flood control structures in the Missouri River Basin. Meanwhile, NOAA's Climate Prediction Center has already raised the possibility of an encore of the climate factors that contributed to the flood. After a summer hiatus, La Niña returned to the Pacific in August. According to Dr. Wayne Higgins, Director of NOAA's Climate Prediction Center, "This is a 'double dip' La Niña, following on the heels of the 2010-2011 La Niña event." While not common, the phenomenon of a double dip La Niña is not unheard of. Predicting the strength of the second dip can be challenging, though. "At this time, we cannot predict the ultimate intensity of the La Niña event," said Higgins, "but we are confident that La Niña increases the potential for major flooding in the north-central U.S. next spring." Floods As a Sequel to DroughtWater isn't always as bountiful in the Missouri Basin as it was this past summer. In fact, just a few years ago, the basin was in an extreme drought. Jesse Aber, from the Montana Department of Natural Resources remembers those years well. "The 2000s were just awful to Montana, like what Texas is going through now," he said. "We were operating on a thread." Rather than focusing on the negatives, though, Aber said people focused on opportunities to be better prepared. "People started to realize climate forecasts are important, and they wanted to know more about them," he said. Aber has found a partner in Dr. Vikram Mehta, an atmospheric scientist with the Center for Research on the Changing Earth System, a non-profit research group partially funded by NOAA. Mehta is investigating two ocean temperature patterns that might provide some direction to the region's climate over decade-long time spans: the Pacific Decadal Oscillation and the Tropical Atlantic Gradient. The Pacific Decadal Oscillation describes shifts in ocean temperatures in the northern and equatorial Pacific. The basin generally spends 20-30 years in a cool phase, and then it shifts suddenly to a warm phase. |
|
|
|
|
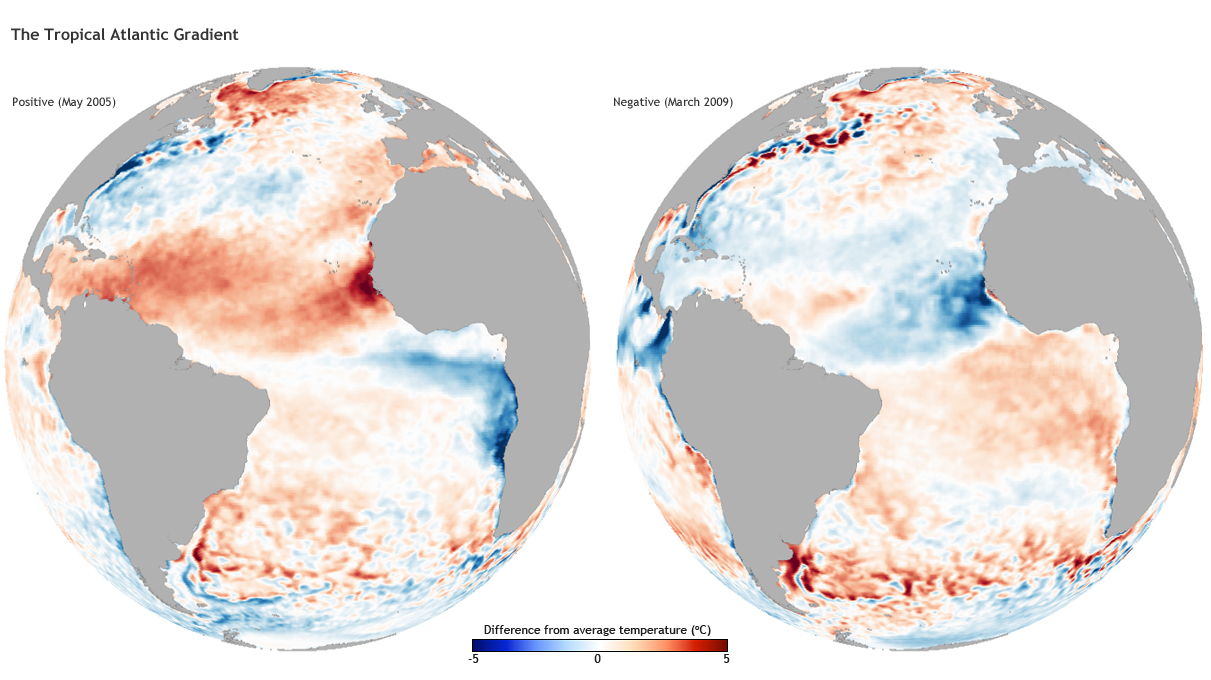
The Tropical Atlantic Gradient (also known as the Atlantic Meridional Gradient Mode) shifts on shorter timescales. In one phase of the cycle, the tropical Atlantic north of the equator is, on average, warmer than usual while the tropical Atlantic south of the equator is cooler than usual. Every 5-8 years, the pattern flips. |
|
|
|
|
Mehta's early research suggests that these oscillations may have influenced multi-year wet and dry cycles in the Missouri River Basin since the 1930s. However, their relationship is imperfect when it comes to year-to-year prediction. The two patterns may "compete" with one another, for example, and other influences, like La Niña, can overwhelm them. For example, by spring 2011, both the Pacific Decadal Oscillation and the Tropical Atlantic Gradient were in phases that more commonly favor warm, dry conditions in the basin*, which was obviously not the case. (*The original version of this sentence said that the two climate patterns favored warm, dry winters. So far, Mehta has only investigated the relationships for the spring/summer growing season.) While they may not be the right tool for making decisions in a single year, Aber still sees how Mehta's research can help in the long-term. That's the story he, Mehta, and others involved in the long-term climate forecasting project have told to over 100 stakeholders in the Missouri River Basin who have attended workshops and meetings over the past two years. "If you're an agricultural producer and you are privy to a climate forecast that it will most likely be wet for multiple years, you can make that decision to invest in expensive equipment with a degree of confidence," Aber said. Other applications of long-term forecasts could include irrigation, infrastructure upgrades, purchasing extra cropland when prices are low, and other planting decisions. He's not the only one showing enthusiasm about these prospects. "We have extension agents fired up about using climatology to assist constituents with cropping advice," he said. "Watching engineers and municipal water managers realize that they can have an information hedge on a 10-year timeframe regarding infrastructure construction decisions is pretty cool as well." References Congresswoman Lynn Jenkins' Website. (2011, November 3). House to hold hearing on Missouri River Flooding. Accessed November 14, 2011. Lilienthal, H. (2001, October 3). Iowa Farm Bureau Study Estimates Missouri River Flooding to Cause $207 Million in Crop and Economic Losses. Iowa Farm Bureau Website. Accessed November 14, 2011. National Weather Service. (2011). NOAA Climate Prediction Center (2011, October 20). Three-month Outlook: Precipitation Probability, Valid NDJ 2011. Accessed November 14, 2011. NOAA Climate Prediction Center (2011, October 20). Three-month Outlook: Temperature Probability, Valid NDJ 2011. Accessed November 14, 2011. Mehta, V. M., Rosenberg, N. J., & Mendoza, K. (2011). Simulated Impacts of Three Decadal Climate Variability Phenomena on Water Yields in the Missouri River Basin1. JAWRA Journal of the American Water Resources Association, 47(1), 126-135. doi:10.1111/j.1752-1688.2010.00496.x U.S. Army Corps of Engineers, Missouri River Joint Information Center. (2011, September). Operation Mighty Mo (pdf), Issue 2. U.S. Army Corps of Engineers, Omaha District. 2011 Flood Response Information Website. U.S. Department of Agriculture, Natural Resources Conservation Service. (2011). Missouri River Basin Mountain Snowpack as of May 1, 2011. Accessed November 14, 2011. Webb, et al. (2011). The 2010-2011 Missouri River Flood: An experimental rapid assessment of weather and climate conditions leading to high flows (ppt). Accessed November 14, 2011. Flooded farmland in the Missouri River Basin in 2011. Photo © Lee Valley, Inc. Links U.S. Army Corps of Engineers Missouri River Basin Webpage AP: Corps Changing Missouri River Plan After Flooding NOAA/NWS Missouri River Basin Forecast Center ENSO Forecast Discussion (NOAA Climate Prediction Center) ENSO Quicklook (International Research Institute for Climate & Society Water Resources Division of the Montana Department of Natural Resources and Conservation Mehta, V., Knutson, C., Rosenberg, N., Olsen, J., Wall, N., and Bernadt, T. (n.d.) An Assessment of Decadal Drought Information Needs of Stakeholders and Policymakers in the Missouri River Basin for Decision Support, Part III: Urban Water Security in the Missouri River Basin (pdf). (Final report provided to the NOAA-Climate Program Office-Sectoral Applications Research Program following a workshop held on November 16-17, 2010, in Lincoln, Nebraska. ) |