Researchers have gained new insights about a marine heatwave in the Northwest Atlantic in 2017. Their newly published study shows how circulation patterns likely influenced the event
Ariane Arias-Ortiz discusses her journey to her current career.
Use this interactive map to browse a collection of animated gifs showing monthly sea level at U.S. tide-monitoring stations over their lifetimes.
Spectacular footage from inside a hurricane; a major ocean mapping milestone; new insights on the continued impacts of climate change, and much more. As the year draws to a close, we’re taking a look back at a few of our biggest research stories of the last 12 months
Failed monsoon rains that reignited the southwestern U.S. drought. A spring heat wave in western Europe. Intense Siberian wildfires. Scientists say human-caused climate change made these extreme weather events more likely, according to new research published today in the Bulletin of the American Meteorological Society (BAMS).
NOAA and partners have launched approximately 100 new Argo floats across the Atlantic Ocean to collect data that supports ocean, weather and climate research and prediction. These will bolster the international Argo Program, which maintains a global array of about 3,800 floats that measure pressure, temperature and salinity of the upper 1.2 miles of the ocean.
Data-driven tools will help communities accelerate equitable resilience.
The fingerprints of La Niña were all over the global precipitation map.
Pattrn, a group committed to data-driven, participatory fact mapping, highlighted work by the Western Water Assessment (WWA) Regional Integrated Sciences and Assessments (RISA) team in a new video.

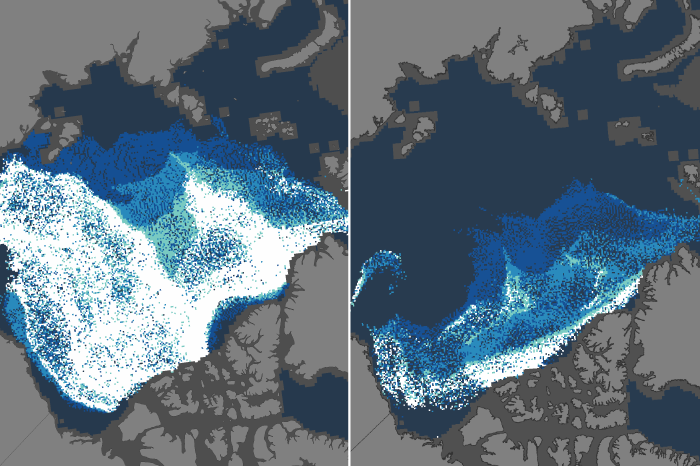
Ice older than 4 years once dominated the winter ice pack in the Arctic. Today, only a tiny fraction of old, thick survives.