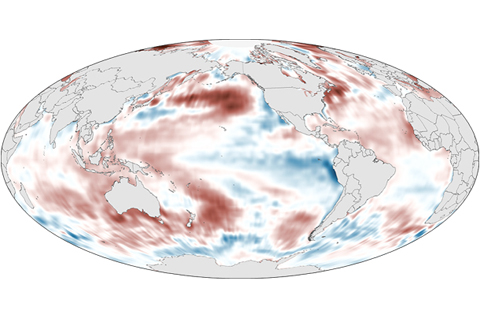
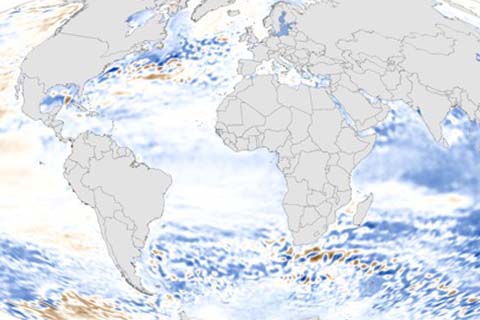
The globally averaged sea surface temperature in 2013 was among the 10 highest on record, with the North Pacific reaching an historic high temperature. ENSO-neutral conditions and a negative Pacific Decadal Oscillation pattern had the largest impacts on global sea surface temperature in 2013.
Upper ocean heat content has increased significantly over the past two decades. An estimated 70 percent of the excess heat has accumulated in the top 2,000 feet of the ocean, and the rest has flowed into deeper ocean layers.
In 2013, global average sea level was 1.5 inches above the 1993-2010 average, which is the highest yearly average in the satellite record (1993-present). Overall, sea level continues to rise at a rate of one-eighth of an inch per year.
The most likely explanation for the lack of significant warming at the Earth’s surface in the past decade or so is that natural climate cycles caused shifts in ocean circulation patterns that moved some excess heat into the deep ocean.
Global average sea level in 2012 was 1.4 inches above the 1993-2010 average, which was the highest yearly average in the satellite record. Sea level has been rising over the past century, and the pace has increased in recent decades.
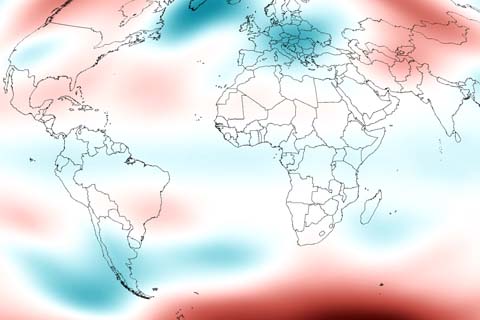
Observing temperature patterns in the lower stratosphere—second major layer of the atmosphere—gives scientists clues about our planet’s changing climate.
Sea surface temperature—the average temperature of water at the surface of the global ocean—is a key indicator of the ocean's status.
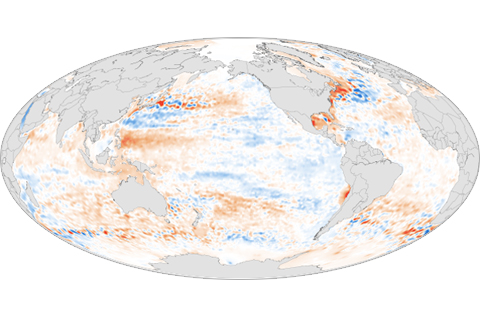
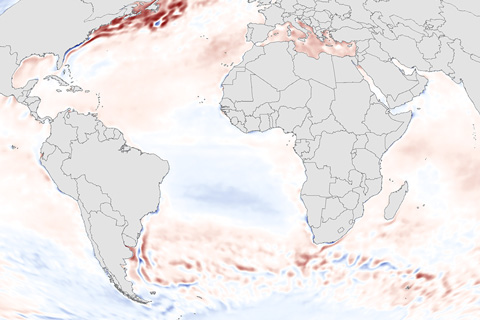
The ocean’s ability to store and release heat over long periods of time gives it a central role in stabilizing Earth’s climate system. But when the ocean absorbs more heat than it releases, its heat content increases. Warming causes water to expand, raising global sea level. Higher water temperatures can also threaten marine ecosystems, disrupting fisheries and the people who depend upon them. The upper ocean held more heat than average in 2012 in most of the major ocean basins, with the exception of the Pacific Ocean.
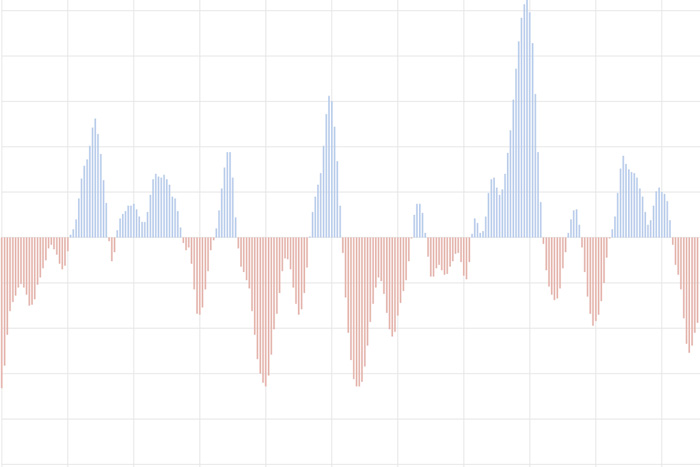
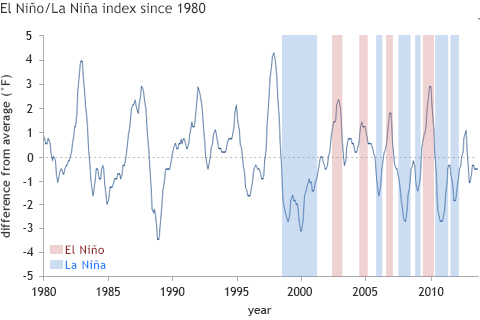
The Oceanic Nino Index tracks the sea surface temperature in the east-central tropical Pacific Ocean. It is NOAA's primary indicator of the climate patterns known as El Niño and La Niña.
A La Niña Watch has been issued by NOAA's Climate Prediction Center. But also, we are still in El Niño! Confused? Let the ENSO bloggers explain.