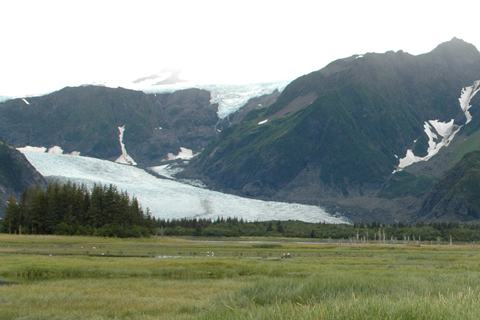
Glacier mass balance in 2011 (the most recent year for which worldwide analysis is complete) was negative, and preliminary data indicate that 2012 will probably be the 22nd consecutive year of net losses in glacier mass. Between 1980 and 2011, glaciers around the world lost the water equivalent of 15.7 meters. That would be like slicing a roughly 17-meter-thick slab off the top of the average glacier and repeating that exercise worldwide.
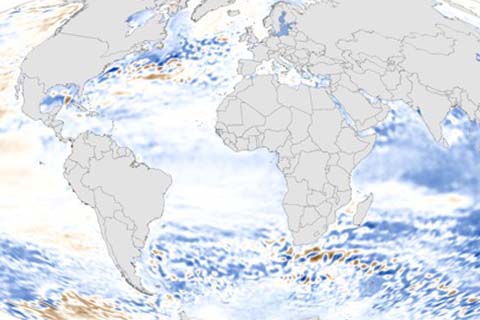
Global average sea level in 2012 was 1.4 inches above the 1993-2010 average, which was the highest yearly average in the satellite record. Sea level has been rising over the past century, and the pace has increased in recent decades.
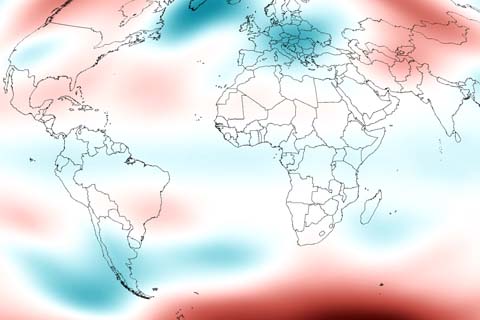
Observing temperature patterns in the lower stratosphere—second major layer of the atmosphere—gives scientists clues about our planet’s changing climate.
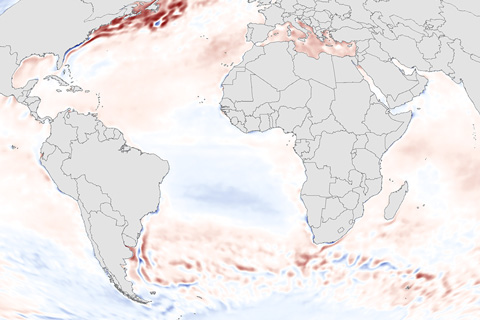
Sea surface temperature—the average temperature of water at the surface of the global ocean—is a key indicator of the ocean's status.

In 2012, sea ice melted to a record-breaking minimum extent. At the end of the summer melt season, ice covered only about half of the average area it did from 1979–2000.
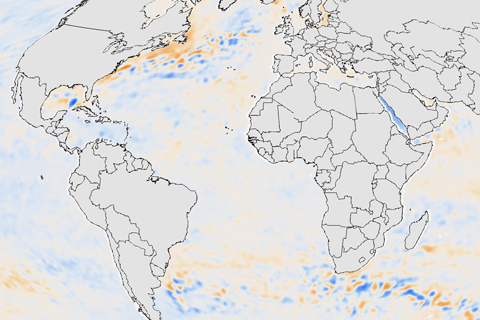
The ocean’s ability to store and release heat over long periods of time gives it a central role in stabilizing Earth’s climate system. But when the ocean absorbs more heat than it releases, its heat content increases. Warming causes water to expand, raising global sea level. Higher water temperatures can also threaten marine ecosystems, disrupting fisheries and the people who depend upon them. The upper ocean held more heat than average in 2012 in most of the major ocean basins, with the exception of the Pacific Ocean.
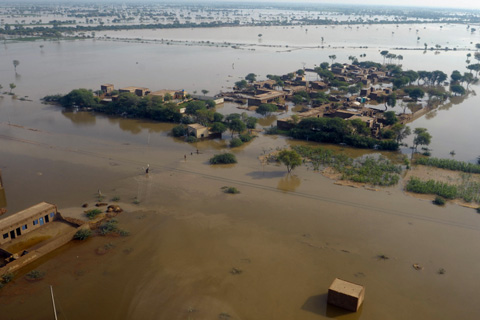
From devastaing fires to the year's strongest cyclone, explore this interactive map of significant weather and climate events documented in the State of the Climate in 2012 report.
2011 State of the Climate Report editor Jessica Blunden talks about the process of creating and editing the report.