No El Niño yet, but temperatures in tropical atmosphere are already warm
This is a guest post from Prof. Adam Sobel, Dept. of Applied Physics and Applied Mathematics & Dept. of Earth and Environmental Sciences, Columbia University. He has also started his own blog, adamsobel.org, and his book about Hurricane Sandy, Storm Surge, will be published by HarperCollins on October 14.
In mid-July 2014, Michelle hypothesized that the reason El Niño was having trouble getting started was that although eastern Pacific sea surface temperatures (SST) were above average, they weren’t being felt by the atmosphere (1). While the central and eastern Pacific were warm, so were the western Pacific and Indian Ocean—so the SST gradient was small (2)—and the gradient is one factor that matters to the atmosphere, because it drives the winds.
That is a convincing explanation for why the SST anomalies in the eastern Pacific have not led to a full blown El Niño yet. In this post, though, I want to explore a different way in which the ocean influences the atmosphere, through the temperature of the entire tropical atmosphere.
As of late August, tropical atmospheric temperatures appear to be responding more strongly to the ocean than they typically do at this early stage of El Niño development. This may be precisely because the tropical ocean as a whole (as Michelle described her in post), rather than just the eastern Pacific, is already warm.
Three-month running averages of tropical average (25°S- 25°N) tropospheric temperature anomalies (blue line) and Niño-3.4 sea surface temperature anomalies (a measure of ENSO; orange line). Both time series are standardized. Tropospheric temperatures are computed between 850-200hPa using the NCEP/NCAR Reanalysis with a base period from 1981-2010. The Niño-3.4 index is computed using OISSTv2 with a 1971-2000 base period. Graphic is courtesy of the IRI map room.
Figure 1 shows two time series (3): in orange, the Niño 3.4 SST index, one primary measure of the state of ENSO and, in blue, the tropical mean tropospheric temperature (4). Notice two things:
1. The two curves tend to track each other closely, particularly for stronger El Niño and La Niña events, as noted by large excursions from the dashed horizontal line, which indicates average conditions.
2. The Niño-3.4 SST index (orange) usually precedes the tropospheric temperature (blue), up to 6 months ahead of time.
Here is my interpretation of this, as explained in a couple of papers written about a dozen years ago with a few colleagues (Sobel, Held and Bretherton 2002; Chiang and Sobel 2002).
The temperature of the atmosphere is about the same everywhere in the tropics, as long as you stay at a fixed altitude or pressure level (5). At the same time, for reasons I’m not explaining here, the ocean surface can sustain somewhat larger temperature gradients than the atmosphere can. So, in general, a tropical atmosphere with the same temperature (again at a fixed level) sits over a tropical ocean with a wider range of temperatures.
But the temperatures of the atmosphere and ocean are linked together because they exchange heat (and water vapor) with each other. That heat exchange occurs at the air-sea interface, and is carried up into the atmosphere by tall, rain-producing clouds. So neither the ocean surface nor the atmosphere can change its temperature without influencing the other.
If the ocean gets a little warmer relative to the atmosphere, the atmosphere just above the sea surface gets more warm and humid, and that warm, humid air becomes buoyant and rises in clouds. The heating that occurs in the clouds when water vapor condenses is then distributed throughout the atmosphere by large-scale circulations, which maintain horizontal uniformity of temperature within the tropics.
At the same time, the clouds will shade the sea surface from the Sun, cooling it, and the storm circulations generated by the clouds will bring cool, gusty downdrafts, which will cool the surface further. If the ocean gets a little cooler relative to the atmosphere, the process works in reverse: clouds will be reduced because the cooler and drier air at the surface will be less buoyant, and more sunlight and a calmer surface will allow the surface to warm up.
In an ENSO event, the SST anomalies in the central and Eastern Pacific are often generated by ocean dynamics (6). However, in the early stages of an El Niño, the surface warmth in the eastern and central Pacific—at least those portions already warm enough to support convective clouds—is carried up into the atmosphere by those clouds. That warms the atmosphere above the SST anomalies. Because the tropical atmosphere can’t sustain large horizontal differences (gradients) in temperature, the heat exchange ultimately warms the rest of the tropical atmosphere as well.
So early in a typical event, the atmosphere in regions far from the eastern Pacific SST anomalies—say, in the Indian Ocean, western Pacific, or Atlantic—becomes a little warmer relative to the ocean surface than it would normally be. Essentially, the atmosphere there already knows about the building El Niño event, while the ocean doesn’t, yet. The ocean is now relatively cool compared to the atmosphere, so convection is suppressed in those regions. This allows them to warm up further.
The warming takes some time, though. Ocean temperatures change more slowly than atmospheric temperatures, because the layer of water in the upper ocean that is involved is heavier than the atmosphere and takes more heat for any given temperature change. Before those remote ocean regions have warmed fully, their relative coolness acts as a brake on the warming of the atmosphere.
This brake explains the lag between the tropospheric temperature and the Niño3.4 SST: the Niño3.4 is trying to warm the whole atmosphere, but it has to drag the rest of the tropical ocean with it, and that slows the atmospheric warming down.
That’s how the interaction usually works, anyway. But now look at the end of the time series, showing almost up to the present. The orange and blue lines are right on top of each other. This time, as shown earlier by the ENSO bloggers, most of the tropical ocean surface—not just the eastern and central Pacific—is already warm, not even waiting for El Niño to officially arrive.
So I’m arguing that the atmosphere is warmer than it would usually be at this stage, relative to the Niño3.4 region, because the rest of the ocean isn’t providing the thermal brake that it normally does. It doesn’t need to be warmed up along with the atmosphere, because it’s already there.
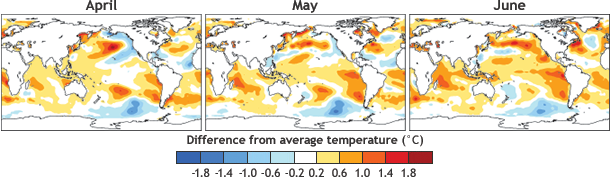
Sea surface temperature (SST) anomalies in April, May, and June 2009 (preceding the onset of El Niño in July 2009). Notice how above-average SSTs (orange/red shading) cover most of the tropical oceans. Data from ERSSTv3b (NOAA NCDC). Map by NOAA Climate Prediction Center and modified by Climate.gov.
For another piece of evidence that this is the case, look at the only other time the two curves were on top of each other: 2009-2010, an event that eventually turned into at least a respectable El Niño. Figure 2 shows the SST anomaly map from the months just before that event officially began. Like now, most of the tropical ocean was already warm.
So while this may not yet be a proper El Niño, as far as the tropical atmospheric temperature is concerned, it’s several months ahead of schedule.
Footnotes:
(1) As of early July 2014, NOAA CPC/IRI and the Bureau of Meteorology in Australia wrote in their updates that certain atmospheric features commonly associated with ENSO were not present. These included: lack of sustained negative Southern Oscillation Index values, lack of enhanced tropical rainfall in the western/central tropical Pacific, lack of reduced rainfall near Indonesia, and lack of westerly low-level winds across most of the western to central Pacific.
(2) An SST gradient describes a change in temperature from one location to another. In the case above, the small gradient refers to changes in the SST anomalies.
(3) These time series are showing standardized anomalies, which are deviations from the climatology, or long-term average at the given time of year, divided by their respective standard deviations over time.
(4) The temperature of the atmosphere is averaged vertically over a deep layer from 850 hPa, around a mile above the surface, to 200 hPa, near where the stratosphere starts, and averaged in latitude and longitude over the whole tropics, from 25S to 25N. Just think of it as the temperature of the entire tropical atmosphere.
(5) There are no temperature fronts in tropical weather disturbances the way there are in higher-latitude ones. This is because of the weak Coriolis force in the tropics, a fundamental consequence of the earth’s spherical shape.
(6) SSTs in the eastern Pacific result from changes in the strength of the upwelling that bring cold water from depth up to the surface in the cold tongue. The upwelling in turn is controlled by the surface winds. So the SST anomalies can still be thought of as driven by the atmosphere - but by the circulation, not the temperature. That circulation, in turn is what responds to the SST gradient, resulting in the Bjerknes feedback that is fundamental to ENSO.
--Michelle L'Heureux, lead reviewer
References:
Chiang and Sobel 2002: Tropical tropospheric temperature variations caused by ENSO and their influence on the remote tropical climate. Journal of Climate, 15, 2616-2631.
Sobel, Held, and Bretherton, 2002: The ENSO signal in tropical tropospheric temperature Journal of Climate, 15, 2702-2706.
Comments
Divergence after 1990
RE: Divergence after 1990
Sotheast Alaska weather
Other temperature observations missing?
re: Wind anomalies: How to read them?
RE: re: Wind anomalies: How to read them?
You're right, it refers to the altitude. hPa = hectoPascal, equivalent to millibars. Pressure decreases with altitude, so 200hPa is high in the troposphere.
Air temperature data
Add new comment