2013 State of the Climate: Ocean heat content
Why It Matters
The ocean’s ability to store and release heat over long periods of time gives it a central role in stabilizing Earth’s climate system. Yearly and even decades-long variations in ocean heat content occur due to natural climate patterns like El Niño and the Pacific Decadal Oscillation. These shorter-term and regional variations in heat content influence regional climates, tropical cyclones, and marine life, including coral reefs and fisheries.
Today, natural patterns occur against a backdrop of long-term increases in global average heat content: evidence of climate change. Over the long-term, the increase contributes to rising sea level, increased melting of outlet glaciers on Greenland and Antarctica, and chronic stress to some marine ecosystems.
Conditions in 2013
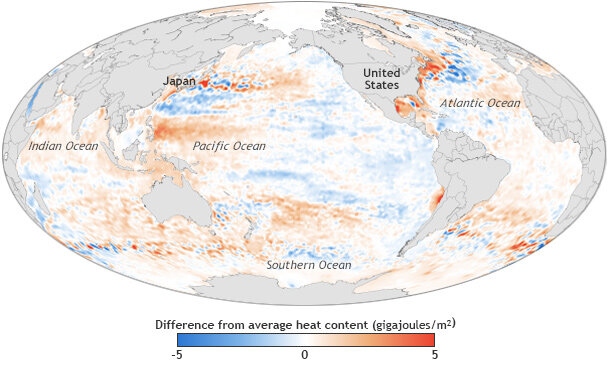
Heat energy in the top 2,300 feet (700 meters) of the ocean in 2013 compared to the 1993-2013 average. Orange and blue areas show where the upper ocean’s heat storage rose or fell by as much as 5 gigajoules per square meter. NOAA map by Larry Belcher, based on heat content data provided by John Lyman. Adapted from Figure 3.5(a) in State of the Climate in 2013.
Heat content in the upper 2,300 feet, or a little less than one-half mile, of the ocean continued its upward trend in 2013. Similar to previous years, the upper ocean held more heat than average throughout most of the major ocean basins visible on the map above.
Unlike 2011 and 2012 when La Nina conditions were present, neutral ENSO conditions prevailed throughout 2013. Heat content patterns in the tropical Pacific reflected this state: slightly less heat energy than average in the eastern part of the basin and slightly more heat than average in the west.
The heat content in the North Pacific was consistent with the negative (cool) phase of a long-term, natural climate pattern called the Pacific Decadal Oscillation. The classic signal of a negative PDO phase is a pocket of warm water in the central North Pacific that is surrounded by a horseshoe-shaped area of cool water pinned to the west coast of North America.
Some of the biggest differences from average conditions occurred off the coasts of the northeastern United States and Japan, stretching east to west in a sharply divided line of warm and cool anomalies. These anomalies are associated with variation in the strength and location of regional currents: the Gulf Stream in the North Atlantic and the Kuroshio in the Northwest Pacific.
Change Over Time
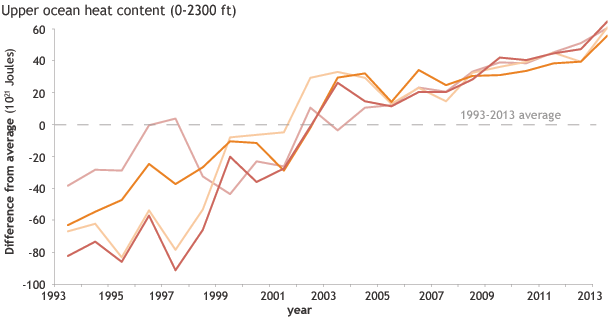
Annual difference from average ocean heat content since 1993 from several data sources. Despite difference in exact values among data sources, the overall trend is similar: heat content in the global ocean has risen in the past two decades. Graph adapted from Figure 3.7 in State of the Climate in 2013.
Increasing concentrations of greenhouse gases are preventing heat radiated from Earth’s surface from escaping into space as freely as it used to; most of the excess heat is being stored in the upper ocean. As a result, upper ocean heat content has increased significantly over the past two decades.
Recent studies estimate that warming of the upper oceans accounts for about 63 percent of the total increase in the amount of stored heat in the climate system from 1971 to 2010, and warming from 700 meters to the ocean floor adds about another 30 percent.
On a regional basis, the long-term increase in ocean heat content is stronger in some ocean basins than others, likely due to the combined influences of long-term climate change and natural climate variability operating over a shorter time frame. Virtually no areas of the Indian Ocean show declining heat content, but in the other basins, some localized pockets of decreasing heat content stand in contrast to the overall warming trend, including some of the subtropical North Atlantic, the Pacific south of Alaska and along the U.S. West Coast, and the Southern Ocean off the tip of South America.
Reference
G. C. Johnson, J. M. Lyman, J. K. Willis, S. Levitus, T. Boyer, J. Antonov, S. A. Good, C. M. Domingues, and N. Bindoff, 2013: [Global Oceans] Ocean Heat Content [in “State of the Climate in 2012”]. Bulletin of the American Meteorological Society (BAMS), S54-S60.
Rhein, M. and Coauthors, 2013. Observations: Ocean. Climate Change 2013: The Physical Science Basis, T.F. Stoker et. al., Eds., Cambridge University Press, 255-315.
Related Links
2012 State of the Climate: Ocean Heat Content