Can Record Snowstorms & Global Warming Coexist?
A major snowstorm hit the U.S. mid-Atlantic region on Dec. 19, 2009, laying down more than 20 inches of snow in some locations. That storm alone set new records for December snowfall totals in the region, but Old Man Winter wasn’t done yet. Another major snowstorm hit the region on Feb. 6, 2010, and then a third storm pummeled the region with blizzard conditions on Feb. 10. Together, those three storms contributed the majority of the record-breaking winter snow totals in the region—55.9 inches of snow at Reagan National Airport, 79.9 inches at Baltimore-Washington Airport, and 71.6 inches in Philadelphia.
Ironically, while people living in the mid-Atlantic region received record-setting snow totals, people in Vancouver, Canada, experienced their warmest January ever recorded. Organizers of the 2010 Winter Olympic games used trucks and helicopters to bring in snow to prepare the slopes in time for skiing and snowboarding competitions.
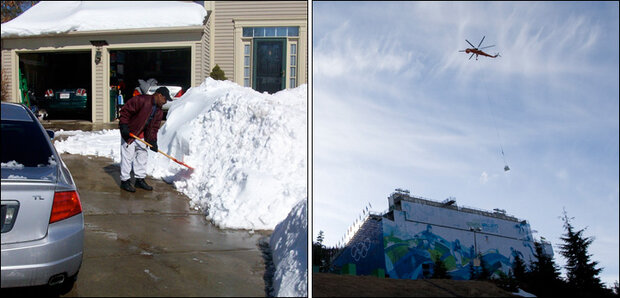
A resident of Bowie, Maryland, clears snow from his driveway (left) while Olympic organizers use helicopters to import snow to the slopes near Vancouver, Canada, to prepare the slopes for the 2010 winter games (right). Left photo courtesy of David Herring, NOAA; right photo courtesy of Jonathan Hayward, AP.
Still, bitter cold temperatures and blizzards of historic proportions prompted the questions: Why were there so many historic snowstorms in the mid-Atlantic region this winter? Are they evidence that global warming isn’t happening?
No, the globe is warming. But the real story behind the mid-Atlantic’s winter isn’t about climate change, it’s about climate variability. Climate variability, the term scientists use, explains why record-breaking snowstorms and global warming can coexist. In fact, many of the weather events observed this winter help to confirm our understanding of the climate system, including links between weather and climate.
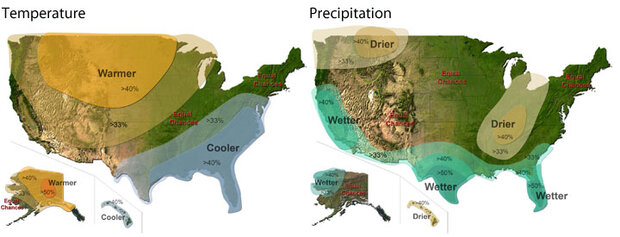
2009 Winter Outlooks for Temperature (left) and Precipitation (right) issued by NOAA’s Climate Prediction Center on October 15, 2009.
On October 15, NOAA announced its 2009 U.S. Winter Outlook in which we called attention to a well-understood climate variation - the periodic warming of central and eastern tropical Pacific waters called El Niño. Our Winter Outlook emphasized the potential for wet, stormy weather across the southern United States, with drier conditions prevailing in the Pacific Northwest and the Ohio Valley regions. As predicted, these conditions did occur this winter. For example, wet and stormy weather caused flooding and mudslides in California, and severe thunderstorms were more frequent than usual in the Southeast. Meteorologists in Seattle reported an unusually warm and mild winter.
El Niño conditions occur when Pacific sea surface temperature in the region highlighted above is warmer than average. That warm water produced higher-than-average evaporation and brought moisture toward the continental United States. Click the image to play the movie showing how El Niño-influenced wind patterns carried moisture northward and eastward from the Pacific Ocean across the southern half of the United States. Animation courtesy of Ned Gardiner, NOAA, and Science Bulletins.
But El Niño wasn't the only major player on the climate stage this winter. At the time we announced the Winter Outlook there was no indication that we would also experience the most extreme behavior on record of another important actor on the climate stage: the Arctic Oscillation. In early December 2009, the Arctic Oscillation flipped into its negative phase, shifting the polar jet stream southward and funneling frigid blasts of Arctic air into North America, northern Asia and Europe. This climate phenomenon explains why people in those areas experienced much colder-than-average temperatures during December 2009 – February 2010.
Atmospheric air pressure conditions oscillate between two common patterns in the Arctic and surrounding regions. In the positive phase of the oscillation, lower-than-average pressure over the Arctic and higher-than-average pressure over the surrounding region tends to keep cold, polar air locked up within the polar region. When conditions flip to the negative phase of the oscillation, air pressure is higher than average over the Arctic and lower than average over the surrounding regions. This situation allows cold, dense air from the Arctic to push southward from the polar region to locations in the middle latitudes. Flips back and forth between the positive and negative phases of the Arctic Oscillation occur routinely.
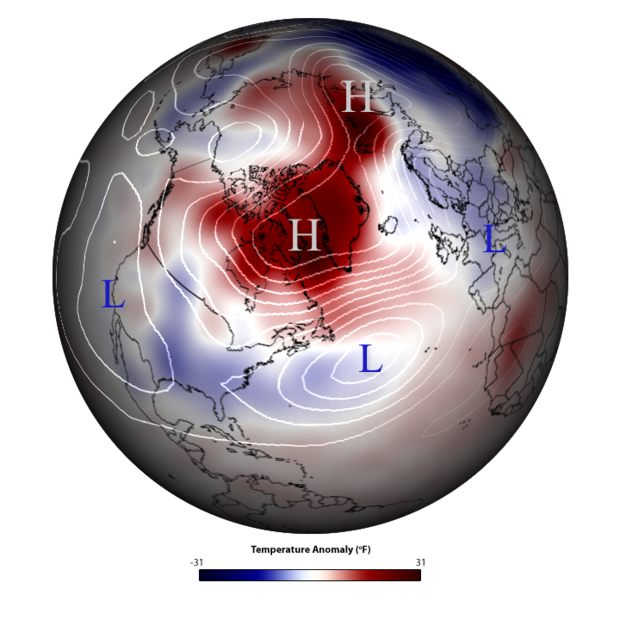
In early December 2009, the Arctic Oscillation entered a strongly negative phase that persisted through early January 2010, and then redeveloped in February. Arctic air maintained higher pressure than lower latitude air masses, allowing the frigid air to push southward. This image shows temperatures for February 1-11, 2010 as the departure from average for the same dates from 1971-2000. The Arctic was warmer than average (red colors) while most of the mid-latitude regions around the world were colder than average (blue colors). NOAA image courtesy of Ned Gardiner, Climate Program Office, and Michelle L’Heureux, Climate Prediction Center.
During the winter 2009–2010 the negative phase of the Arctic Oscillation was very persistent on a day-to-day basis and was also remarkably strong, with the monthly values during December 2009 and February 2010 surpassing the previous lowest monthly values dating to 1950. Thus, the oscillation’s seasonal value (December-February 2009–10) was the lowest in the historical record. Moreover, a cousin of the Arctic Oscillation—called the North Atlantic Oscillation—also had the lowest seasonal value in the historical record. The North Atlantic Oscillation is the regional manifestation of the Arctic Oscillation in the North Atlantic.
[Editor's note: There is ongoing discussion among scientists as to which of the climate patterns is a more meaningful description of real-world conditions—the Arctic Oscillation or the North Atlantic Oscillation? While these phenomena are measured using different indexes, their values are so highly correlated that some scientists use the terms interchangeably, referring to them together simply as “AO/NAO.” Both AO and NAO were at record lows this winter. (For more information about the North Atlantic Oscillation this winter, please see Forensic Meteorology Unravels the Mystery of Record Mid-Atlantic Snows.)]
We’ve seen both El Niño and the Arctic Oscillation many times before. So we know from experience that either one of these climate variations acting alone can cause extreme weather around the globe. Acting together, they dominated weather patterns this winter. The tropical moisture and energy from the Pacific Ocean associated with El Niño and the southward movement of arctic air masses associated with the negative phase of the Arctic Oscillation led to conditions that were just right for producing major snowstorms in the mid-Atlantic region.
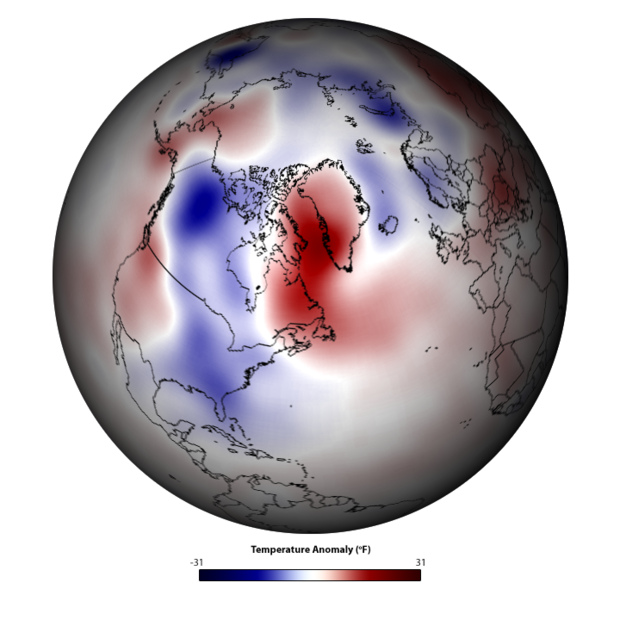
This composite map shows temperature anomalies for periods in the historical record (from 1950-2009) when El Niño and the negative phase of the Arctic Oscillation coincided. Note that this historical composite closely matches temperature anomalies observed this winter. (NOAA image by Ned Gardiner, Climate Program Office, and Michelle L’Heureux, Climate Prediction Center, using data based on NCEP/NCAR Reanalysis with a 1971-2000 climatology.)
But, of course, climate variability works both ways. While some locations experienced bitter cold and blizzards, other locations experienced unusually warm and mild conditions. The contrast in weather between these two locations illustrates why we don’t draw long-term, large-scale conclusions about climate from short-lived, local weather patterns.
So, what’s the difference between weather, climate variability, and climate change? How can scientists accurately predict climate months, years or even decades into the future when they struggle to predict weather accurately more than a week in advance?
Weather and climate are related but they are not the same things. Each describes environmental conditions, but on different scales of time and space. Meteorologists describe the state of the atmosphere at a particular time and place—weather—by measuring its temperature, air pressure, moisture, wind speed and direction, etc. But because the atmosphere behaves like a fluid, these conditions are prone to rapid change. Thus, weather at any one location is inherently difficult to predict more than, say, a week in advance. Climatologists, on the other hand, don’t try to predict weather at one location on such a short timescale. Rather, they look at the bigger picture. Climatologists consider the much larger context in which weather operates and describe the expected frequency and strength of weather conditions.
The stock market offers a good analogy for appreciating the difference between meteorologists and climatologists. Wall Street stock traders deal with the complexities of the stock market’s daily ups and downs. Mutual fund managers, however, don’t worry about the market’s daily volatility. They look at long-term trends and manage investors’ money based upon a long-term perspective and their bigger picture understanding of the large-scale, slower-moving market forces that drive the stock market. Likewise, meteorologists focus on the day-to-day weather conditions, but climatologists aren’t as concerned with what the weather will be tomorrow as they are in determining the likely range and frequency of weather patterns over longer time spans ranging from weeks to seasons, to decades, or even centuries. So, to forecast on these timescales, climatologists need to understand the current state of the large-scale, slower-evolving environmental forces that drive the climate system.
How does all this relate back to the questions of weather versus climate, and scientists’ ability to predict each? Imagining the climate system as an old-fashioned game of pinball helps to illustrate why it’s much harder to accurately predict particular weather events than it is to predict climate more than a week from now. Launch a single ball into the pinball game and it’s hard to predict what pathway it will take and where it will end up. So many different and dynamically interacting variables make it inherently difficult to predict where a single ball will end up after it hits one or two bumpers. This is like the weather. But after observing the pathways and endpoints of hundreds of balls, we can describe the probabilities that a ball will end up at a given location. This is like predicting climate variability.
Suppose we changed the overall conditions of the pinball game by tilting it to one side. This change would inevitably alter the pathways and endpoints of the next hundred balls. While we still wouldn’t be able to accurately predict the end point of any single ball, we would dramatically increase our chances of predicting where most balls will end up. This tilt can be temporary, caused by phenomena like El Niño. However, the tilt can also be more permanent, like the impact of increasing greenhouse gases on global temperatures. So a more permanent “tilt” is like global warming. And, as is true in pinball, in climate the magnitude of the tilt matters.

An old-fashioned pinball game illustrates the difference between weather and climate. It’s hard to say where any single ball will end up. This is like weather. But after hundreds of trials we can describe the probabilities for all possible endpoints. This is like climate. (Photo courtesy of UCAR.)
To understand climate and detect climate change we need to collect data for a long time—the longer the data record the better. The pinball analogy shows why predicting any single weather event is inherently difficult and why we don’t base our assessments of climate on any single weather event. And it shows why we can make probabilistic statements about future climate, given a long data record and a good understanding of the state of the forces that drive the system.
This point is counter-intuitive to many people. We tend to be most aware of and remember what we experience firsthand. A particularly bitter cold snap may seem to us like a good reason to discount reports of global warming. Conversely, a sweltering heat wave may seem like good evidence that global warming is happening. But we cannot draw conclusions about climate change from any single year, much less any particular extreme event.
Our modern understanding of the difference between weather, climate variability, and climate change reinforces the important points that not all parts of the globe will warm at the same rate, nor will warming proceed continuously.
David Herring is Director of Communications and Education in NOAA's Climate Program Office. Wayne Higgins is Director of NOAA's Climate Prediction Center. Mike Halpert is Deputy Director of NOAA's Climate Prediction Center.