Forensic Meteorology Solves the Mystery of Record Snows
This is the second in a two-part retrospective on the mid-Atlantic's record-setting snowstorms of 2009-10. For Part 1, please see Can Record Snowstorms and Global Warming Coexist?
Shortly after the third of three major snowstorms brought record-setting snowfall to the U.S. mid-Atlantic region, NOAA's Climate Scene Investigators (CSI) assembled to analyze why the snowstorms happened. The CSI is a team of "attribution" experts in NOAA whose job is to determine the causes for climate conditions. By distinguishing natural variability from human-induced climate change, they aim to improve decision-making and inform adaptation strategies.
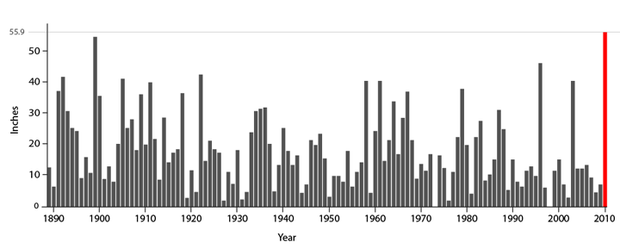
Annual snowfall at Reagan National Airport site for 1888-89 through 2009-2010. The red bar shows the 55.9 inches accumulated through February 11, 2010 that broke the former record from 1898-99. Note that only 3 years of the last 20 have more than the long-term average of 15.2 inches of snow. Data courtesy of NOAA National Weather Service.
The CSI team was formed in 2007, following chaotic media coverage of the record U.S. warmth in 2006 (see CSI: NOAA Climate Scene Investigators). Here they have been called to the scene again, but now to explain cold, snowy conditions, and to reconcile those with a warming planet. After a series of record-setting snowstorms hit the mid-Atlantic region this winter, some people asked NOAA if humans could somehow be to blame. Specifically, they wanted to know if human-induced global warming could have caused the snowstorms due to the fact that a warmer atmosphere holds more water vapor.
The CSI Team's analysis indicates that's not likely. They found no evidence - no human "fingerprints" - to implicate our involvement in the snowstorms. If global warming was the culprit, the team would have expected to find a gradual increase in heavy snowstorms in the mid-Atlantic region as temperatures rose during the past century. But historical analysis revealed no such increase in snowfall. Nor did the CSI team find any indication of an upward trend in winter precipitation along the eastern seaboard.
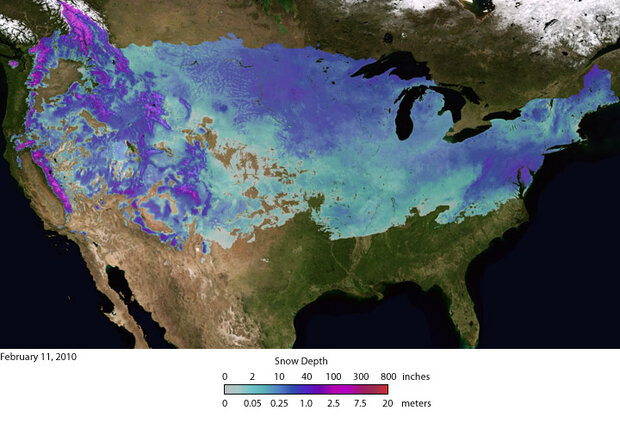
In early February, two weather systems brought record snowfalls to Washington, D.C. and other parts of the U.S. mid-Atlantic region. This image shows the depth of snow that had accumulated at locations across the contiguous United States as of February 11, 2010. Image by NOAA Environmental Visualization Laboratory using data courtesy of NOAA’s National Operational Hydrologic Remote Sensing Center.
The CSI team turned its attention to natural factors that control the ordinary ups and downs of weather. Many extreme weather events are due to cyclical, large-scale anomalies in air pressure and sea surface temperature across large tracts of ocean. Such fluctuations spawn weather systems that can cause droughts, floods, and massive snowstorms. While El Niño is the most famous, scientists have identified other climate anomalies throughout Earth's climate system as well. Their names may seem unimpressive - the Arctic Oscillation, North Atlantic Oscillation, Pacific Decadal Oscillation, to name a few - but they can pack quite a punch!
The Suspects
The CSI team focused on two suspects known to be at large this winter - the negative phase of the North Atlantic Oscillation (NAO) and El Niño. El Niño, with its warming of tropical Pacific Ocean temperatures, may be best known for delivering heavy rains across the southern United States. El Niño events can trigger mudslides in California, floods along the Gulf Coast, and unusual warmth and drought in the Pacific Northwest. The latter should sound familiar: an unusually warm winter from Portland to Seattle was part of the same climate pattern affecting the venue of the Winter Olympics. The CSI Team suspected that El Niño was a conspirator in the United States' unusual winter weather, and that it had an accomplice.
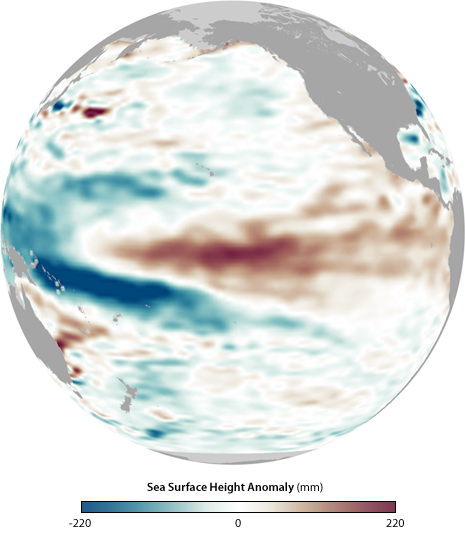
False-color map showing El Niño pattern of sea-surface height anomalies in the equatorial Pacific Ocean on February 15, 2010. Higher areas, shown in red, are warmer than average, and lower areas, shown in blue, are cooler than average. White areas show average heights and temperatures. Image courtesy of NASA Earth Observatory.
The North Atlantic Oscillation is a fluctuating air-pressure pattern that alternatively enhances or blocks the storm-steering jet stream over North America. So the NAO is particularly relevant in understanding eastern U.S. wintertime climate variations. The NAO describes the contrast in surface air pressure between Iceland and the Azores as well as the vigor of the jet stream that normally flows between them.
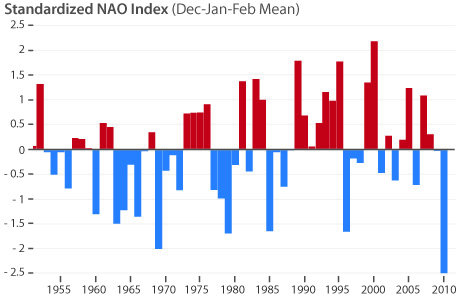
The winter of 2009-10 witnessed the most extreme negative (blocked) NAO phase since at least 1950.
This winter the NAO was in its negative phase and the jet stream flowed further south than usual, pushed toward the Azores by a massive "block" of high surface pressure over Greenland. It's an unusual atmospheric circulation pattern, but one that has been implicated before. For example, remarkably cold winters persisted over Europe and Russia in the early 1940s, helping to turn the tide of World War II. The NAO, in a blocked phase, was one conspirator in those cold events. Likewise, the CSI Team suspected the pattern was a co-conspirator in the extreme winter weather conditions this year in the mid-Atlantic region. But could they find the evidence they would need to finger El Niño and NAO?
[Editor's note: There is ongoing discussion among scientists as to which of the climate patterns is a more meaningful description of real-world conditions - the Arctic Oscillation or the North Atlantic Oscillation? While these phenomena are measured using different indexes, their values are so highly correlated that some scientists use the terms interchangeably, referring to them together simply as "AO/NAO." Both AO and NAO were at record lows this winter. (For more information about the Arctic Oscillation this winter, see Can Record Snowstorms and Global Warming Coexist?)
The Evidence
Negative Phase of the North Atlantic Oscillation
By January, scientists worldwide were already abuzz about the extremely low values for the NAO index. The NAO, first discovered by British atmospheric scientist Sir Gilbert Walker in the 1920s, has been extensively studied, and its affect on U.S. snowfall is clear: When the NAO index is negative, or "blocked," snow can pile up along the East Coast. At the atmospheric steering level for storms, high-pressure systems develop over Iceland and Greenland while low pressure builds over the central North Atlantic. This situation redirects the tracks of surface weather systems that are conducive for cold and snow toward the mid-Atlantic coast. Winter precipitation along the eastern seaboard is often in the form of rain, but in a blocked NAO pattern, temperatures can drop low enough to create snow instead.
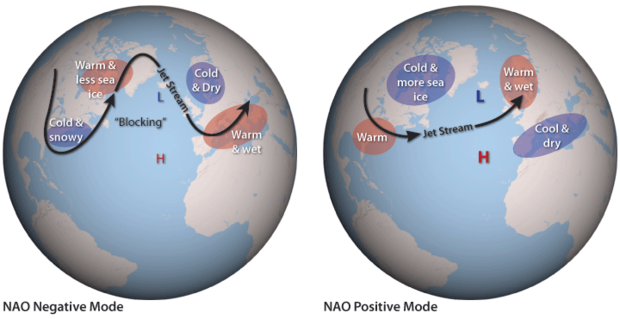
On average, the surface pressure near Iceland is relatively low (L), while the pressure near the Azores Island is relatively high (H). During a negative phase (left), this pressure difference weakens. During a positive phase (right), the difference becomes even stronger than usual. The variation in pressure patterns influences the strength and location of the jet stream and the path of storms across the North Atlantic. Schematic adapted from AIRMAP by Ned Gardiner and David Herring, NOAA.
Historical snowstorms affirm the link. In Baltimore and Washington, D.C., thirteen of the fifteen heaviest snowstorms since 1891 occurred when the NAO index was negative. And case studies of infamous Northeast U.S. storms over the last century, summarized in a Monograph of the American Meteorological Society, have discovered a link to blocked NAO conditions.
The CSI team took its analysis a step further, mapping out historical climate conditions associated with the ten snowiest Decembers, Januaries, and Februaries since 1891. The 30-month composite map of jet stream level and surface conditions revealed a textbook picture of a blocked NAO pattern over the Atlantic Ocean.
El Niño
But the negative NAO didn't act alone. By fall of 2009, a NOAA network of ocean buoys in the tropical Pacific Ocean picked up a moderate El Niño, which strengthened a bit by winter. El Niños typically influence North American climate by displacing the track of wintertime storms across the Pacific Ocean southward, often delivering heavy precipitation into a belt from Southern California through Texas and into the Southeast. The weather pattern also generally cools the eastern seaboard, though not as significantly as a blocked NAO pattern can.
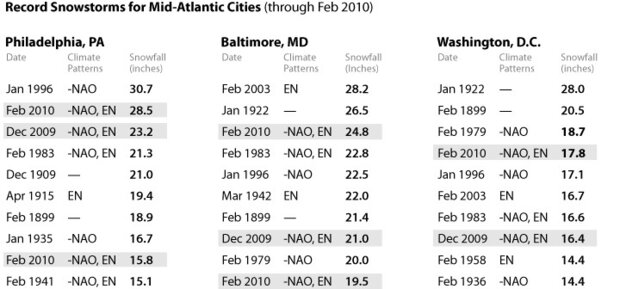
The top 10 heaviest snowstorms for Philadelphia, Baltimore, and Washington, D.C. Snowstorms occurring in years when there was a negative NAO and/or an El Niño are indicated. The shaded boxes highlight the storms from this past winter. Table produced using data courtesy of Jeff Master, Weather Underground, and Klaus Wolter, NOAA ESRL.
Historically, El Niños are associated with more winter snowfall along the East Coast. And many of the biggest snowstorms in mid-Atlantic cities occurred during El Niño years. Of the top ten storms in Washington, Philadelphia, and Baltimore, more than half have coincided with El Niño events. Yet not all El Niños yield heavy mid-Atlantic snowstorms. Notably, there was no statistically significant increase in snowfall during 1997-98, when one of the strongest El Niños of the century occurred.
Co-conspirators
Combing through historical records dating back to the late 1800s, the CSI team identified the separate "fingerprints" of wintertime climate conditions related to El Niño and the NAO. They deduced that NAO conditions alone could explain Europe's extreme winter and the large-scale cold temperatures in the United States, but not the remarkable occurrence of record-setting snowstorms in the mid-Atlantic region. They also found that while El Niño conferred additional risk of storms for the mid-Atlantic, these conditions alone didn't always result in snow. The team then compared the combination of these fingerprints with the 2009-10 conditions. Using a mathematical model to combine the characteristic climate patterns related to El Niño with those of a negative NAO, their reconstructed winter conditions agreed with real-world observations.
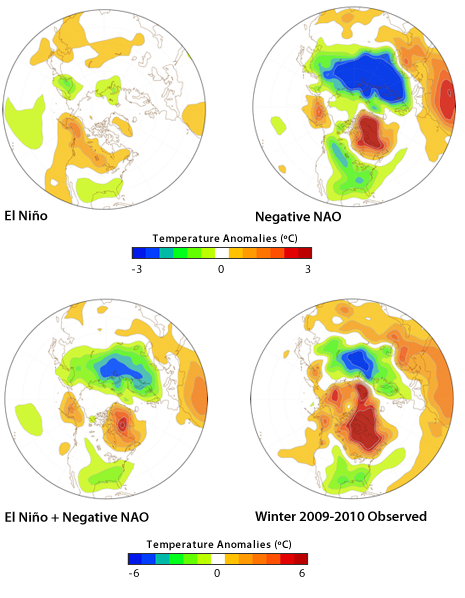
These maps are centered on the North Pole to show near-surface temperature anomalies in the Northern Hemisphere. Asia is at the top of the map and North America is at the bottom. The top pair of maps are long-term composites (from 1951-2010) illustrating typical winter-time influence of El Niño (top left) and the NAO (top right). The bottom pair of maps shows a composite of the combined influence of El Niño and the NAO (bottom left) compared to the real-world observation from December 2009-February 2010 (bottom right). Maps courtesy NOAA Climate Prediction Center.
Wintry Weather in a Climate Context
The CSI Team found abundant historical evidence of heavy mid-Atlantic snowstorms whenever an El Niño and a negative NAO acted in concert, further supporting their conclusion that the record-setting snowstorms were the result of natural causes. But could global warming have elevated the potency of this dynamic duo? Again, the CSI Team didn't find a connection.
While the U.S. shivered this winter, ranking 18th coldest since 1895, the planet's average winter temperature ranked as the fifth warmest on record. Sea surface temperatures ranked second warmest this winter when averaged over the world oceans, according to preliminary data from NOAA's National Climatic Data Center.
But the extreme blocked-NAO of this past winter was opposite to the trend toward more positive phases of the NAO since 1950, and also opposite to projections for a positive trend in the NAO during the 21st Century due to greenhouse gas increases.
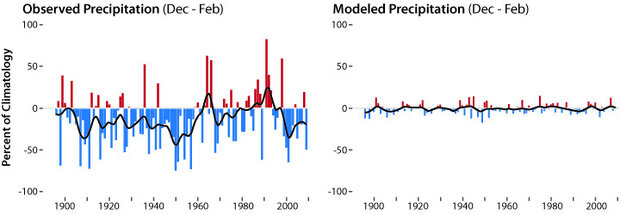
The observed variations of winter precipitation in the Washington, D.C., area (left) have been very different from what models predict would occur if only human-induced emissions of greenhouse gas and aerosols (right) were taken into consideration. This evidence suggests the mid-Atlantic’s trends in precipitation are mainly due to natural variability, not human influence.
Attribution is often in high demand when climate behaves in unusual or extreme ways as it did this past winter. NOAA's ability to respond with the best possible science is critical so that society can anticipate and respond to climate and its impact. For a more detailed science assessment of the causes for this winter's snows, please see Understanding the Mid-Atlantic Snowstorms During the Winter of 2009-2010.
Martin Hoerling is a senior climate scientist at NOAA's Earth System Research Laboratory (ESRL), where he leads the Climate Scene Investigators team. Katy Human and Barb Deluisi are science writers at NOAA ESRL.