Fun with Statistics: El Niño and California Rainfall
Fun with Statistics: El Niño and California Rainfall
With the Thanksgiving holiday fast approaching; my thoughts are quickly shifting from trying to make sense of the current ENSO picture to heaping mounds of stuffing and turkey. With that in mind and with full realization that this is one of the busiest travel days of the year, I tried to keep today’s ENSO blog post simple, involving a question I was asked repeatedly during my recent trip to California:
What’s the deal with El Niño and California rainfall? An El Niño means lots of rain, right?
First off, why are folks so desperate for rain in California? Well, it has been incredibly dry. The drought in California (Figure 1) has been a national news story for over a year. With a large portion of the country’s fruits, nuts, and vegetables coming from the state, drought conditions could affect Americans, no matter where they live, in the form of higher food prices.
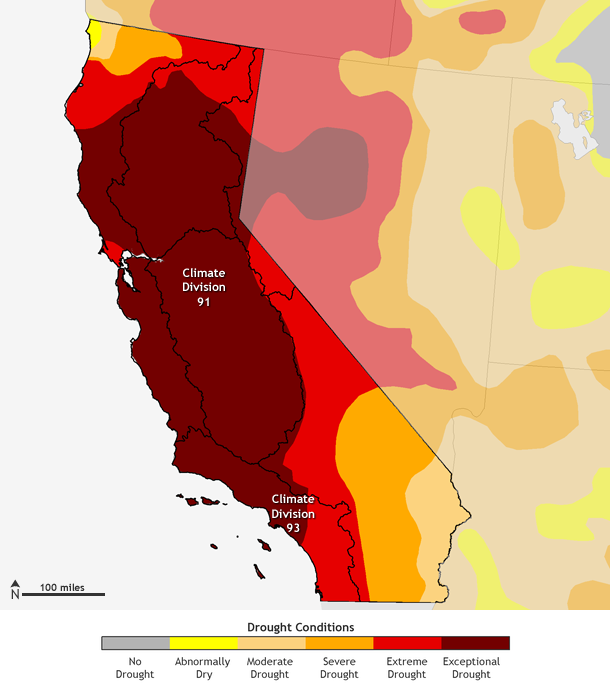
Figure 1. Drought conditions as of November 18, 2014. Currently, 99.72% of the state is under drought with 55.08% of California experiencing “D4,” or Exceptional Drought. Map by NOAA Climate.gov, based on data provided by the U.S. Drought Monitor.
During a normal year in California, rainfall picks up in intensity throughout the late fall into winter. The issue since drought first arrived back in December 2011 is that Mother Nature missed this memo. Dry winter conditions prevailed instead.
We have previously touched on the large-scale impacts an El Niño could have on the United States, namely shifting storm tracks around North America, potentially resulting in an abundance of rainfall for parts of California. We have even discussed what the upcoming winter forecast will be for the United States. And finally we have discussed exactly what we mean when we use probabilities in these types of forecasts. So you may wonder, is it a slam dunk that a developing El Niño causes above-average rain for California?
Not so fast. The first issue is that California is a BIG place. You wouldn’t expect the climate to be the same in northern and southern California, so you shouldn’t expect the impacts of El Niño to be the same either. The second issue is that, as mentioned previously on the blog, no two El Niño events are the same, and thus their impacts aren’t either.
To show this, instead of giving you probabilities and numbers, I am going to let your eyes tell you the story. And no, Figure 2 is not a Rorschach test. (Although personally, I think part (b) looks like a bunny.) Figure 2 shows how, in the past, sea surface temperature (SST) anomalies during the August – October (ASO) time frame were related to the subsequent December-March precipitation totals for certain regions in California. Part (a) shows conditions across southern California and part (b) shows the San Joaquin Valley, where most of the agriculture in California is grown. The dashed line points out the value of the August-October 2014 ENSO index value (called the Oceanic Niño Index).
Figure 2. Total precipitation for December-March (vertical axis) compared to Oceanic Niño Index (ONI) values in August-October (horizontal axis). Part (a) is Climate Division 91, San Joaquin Valley, while (b) is Division 93, the southern California coast. Red dots show ONI values greater than 0.5 (El Niño), blue dots show values less than -0.5 (La Niña), and black dots are neutral ONI values. The black line represents the 2014 August-October ONI value.
Can the past give us a hint at what the future may hold?
Not surprisingly, the two regions have historically seen different impacts from El Niño. In fact, the relationship in the San Joaquin Valley can best be described as “kinda messy.” There are El Niño “years” with lighter amounts of rain... La Niña years with heavy rain.. and neutral years all over the place (1). Yes, if we took an average of all the El Niño, La Niña and Neutral years together, we would discover that, on average, El Niño years meant higher rainfall totals. But from looking at Figure 2b, we know that there is a lot of variability in the historical record. Thus, we can conclude that while El Niño might in general lead to higher rainfall totals, there certainly is no 100% guarantee.
This holds true for areas that show even stronger relationships between SST anomaly and rainfall, such as southern California (Figure 2a). One interesting aspect is that rainfall possibilities during neutral and El Niño are somewhat similar. In other words, the onset of El Niño might not lead to a strong increase of wintertime precipitation compared to Neutral years. Neutral and El Niño years in this region both show a large range of possible outcomes, which includes some pretty wet years (2).
It is only during La Niña (when the tropical Pacific is colder-than-average) when the number of wetter years diminishes. So in this region, a declaration of El Niño versus ENSO-neutral does not historically mean a large change in rainfall probabilities. In either case, there is a wide range of possible rainfall totals, including above-average accumulations.
From the historical record alone, it is clear that there never is a 100% confidence in an above-average, below-average or average rainfall forecast, even if there is an El Niño or La Niña. The best we can say is that there is a tilt in the odds in one direction or another.
This year, forecasters at CPC are tilting the odds toward wetter-than-average conditions over southern California based on model predictions, which do not always depend on the exact state of ENSO (3). Of course, the final rainfall tally, as always, depends on the whims of Mother Nature. About the only thing that I can say with 100% certainty is that come Thanksgiving night, I will be stuffed.
Footnotes
(1) In this specific instance, we are not referring to “years” as in January – December, but to the condition of ENSO during August-October (ASO). In examining the historical record of ENSO episodes, the state of the ENSO index during ASO tends to persist through the coming winter, but this is not always the case either.
(2) I say somewhat similar because if we took an average of all El Niño and Neutral cases in figure 2a, El Niño cases averaged 4.3 inches more rain than Neutral cases over the December-March period. This was due to a larger number of Neutral drier years. However, the point remains that both Neutral and El Niño years have high rainfall cases. Overall, Neutral years have the greatest variance.
(3) Keep in mind that for this analysis, we are showing historical relationships or just those rainfall amounts that occurred over the past ~60 years. But in the official CPC seasonal outlooks, more than just the historical relationships are considered and model predictions are heavily weighted.