Climate Change and ENSO: Take 2
Climate Change and ENSO: Take 2
This is a guest post by Mat Collins, who is the joint Met Office Chair in Climate Change and professor in the College of Engineering, Mathematics, and Physical Sciences at the University of Exeter in the UK. You can follow him on Twitter @mat_collins.
Tom previously touched on how climate change might affect ENSO, emphasizing the 2013 AR5 Intergovernmental Panel on Climate Change (IPCC) statement (footnote 1), which basically said that ENSO (the El Niño-Southern Oscillation) will continue, but we don’t know if or how its frequency or intensity might change.
That’s the answer we get when we look at the question head-on. But what about when we look at it more indirectly? Looking at other elements of the climate system, for example, we can focus on one reasonably robust finding: an intensification of mean rainfall in the central and eastern equatorial Pacific is ‘likely,' according to the IPCC criteria. Recently, my colleagues and I have been focusing on the possibility that these overall rainfall changes may impact ENSO.
Answers at last?
There have been a number of modeling studies since the publication of the IPCC report that have seemed to hint at a clearer picture of future changes in ENSO. The picture began to come into focus when looking at changes in the rainfall response in the equatorial Pacific to an El Niño event (Cai et al., 2014) rather than just changes in the ocean surface temperature in the traditional regions (Niño-3 or Niño-3.4).
By “rainfall response,” I mean the differences in intensity or location of rainfall anomalies during El Niño. During an El Niño event, massive cumulus clouds and rainfall linked to atmosphere convection move away from Indonesia, out into the central or eastern Pacific following the eastward extension of warm waters. Figures 1 and 2 show the shift in convection with transition from ENSO-neutral to El Niño conditions.
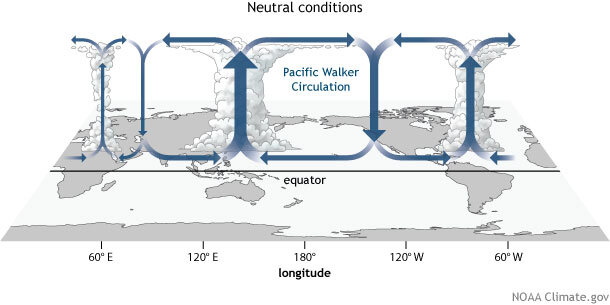
Generalized Walker Circulation (December-February) during ENSO-neutral conditions. Convection associated with rising branches of the Walker Circulation is found over the Maritime continent, northern South America, and eastern Africa. NOAA Climate.gov drawing by Fiona Martin.
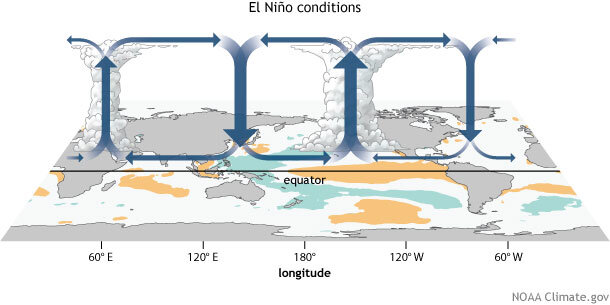
There it triggers large-scale teleconnections, which are responsible for global El Niño rainfall patterns. During very strong or ‘extreme’ El Niño events, such as those that occurred in 1982/3 and 1997/8, the convection reached all the way into the tropical east Pacific, reaching South America (2).
So, if we consider El Niño events only in terms of these rainfall patterns, what do climate models show us? First, we find that not all models can simulate present day conditions very well. However, some do. When we look at the climate change simulations of these better models, we see an increase in instances where rainfall spreads all the way into the east Pacific, as is the case for more extreme El Niños (3) but not for moderate events.
So, there may be some model agreement on changes in the most extreme El Niño events in the future when viewing the phenomena in terms of rainfall patterns rather that SST patterns.
But is that the final answer?
Just because the change is seen in models, or even a subset of models, doesn’t mean that we should believe it without question. Not only do we have to factor in errors or biases in the models, but we also have to have a convincing physical argument for the changes.
A feature of model predictions for the end of the 21st century is an increase in the average rainfall over the equatorial central and eastern Pacific. Average rainfall changes in the tropics are related to changes in atmospheric circulation (Chadwick et al., 2013), which are, in turn, closely tied to changes in sea surface temperature (SST) patterns. In particular, there is a equatorial maximum in SST warming across the Pacific basin which is seen in many different models (Xie et al., 2010).
But these SST changes are occurring in a region where there are known and persistent biases in climate models. The relatively colder SSTs in the east Pacific (“cold tongue”) are often too cold and extend too far into the central and, sometimes, west Pacific. If the models represent the region as being colder than it is at present, the predicted warming they show may be exaggerated. Hence the change in rainfall which seems to occur in all models might be tied to errors in SSTs which are common to all models.
As far as a good physical explanation for the projected changes, one hypothesis for the increase in the frequency of extreme El Niño events is that, because of average rainfall increases in the equatorial Pacific, it is easier for El Niño events to shift atmospheric convection from the west Pacific Warm Pool region into the east. In others words, the atmosphere is already primed to rain harder.
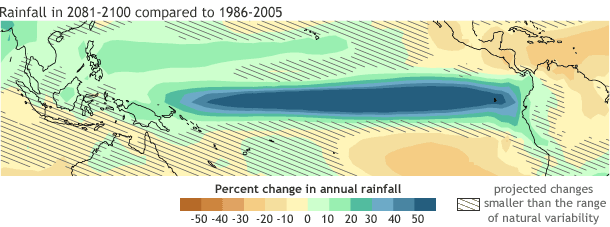
Changes in mean rainfall under Representative Concentration Pathway (RCP) 8.5 for the period 2081-2100 expressed as anomalies with respect to 1986-2005. Hatching indicates regions where the multi-model mean change is less than the natural variability (computed from 20-year averages taken from pre-industrial control experiments). Images generated using http://climexp.knmi.nl/plot_atlas_form.py.
So, the picture of changes in ENSO, when viewed in terms rainfall response patterns, may be limited by errors and biases that have been long-term features in climate models. Research is required to test the potential impact of SST biases on the change in average precipitation in the tropics. We must improve models, but we must also to better understand the processes whereby biases in present-day simulations link to future projections. Until we get a better handle on these issues, the prediction of an overall increase in rainfall in the eastern tropical Pacific, and its year-to-year variability, remains uncertain.
Footnotes
(1) “…there is high confidence that ENSO very likely remains as the dominant mode of interannual variability in the future and due to increased moisture availability, the associated precipitation variability on regional scales likely intensifies…However, natural modulations of the variance and spatial pattern of ENSO are so large in models that confidence in any specific projected change in its variability in the 21st century remains low.” [Chapter 14, Executive Summary]
(2) For weaker El Niño events, increased rainfall and convection will not spread as far eastward across the equatorial Pacific and may only remain in the central Pacific.
(3) A similar result is obtained when we look at the rainfall response to both El Niño and changing climate using atmosphere-only experiments (Power et al., 2013).
References
Cai, W. et al. Increasing frequency of extreme El Nino events due to greenhouse warming. Nature Climate Change 4, 111-116, doi:10.1038/NCLIMATE2100 (2014).
Power, S., Delage, F., Chung, C., Kociuba, G. & Keay, K. Robust twenty-first-century projections of El Nino and related precipitation variability. Nature 502, 541-+, doi:10.1038/nature12580 (2013).
Chadwick, R., Boutle, I. & Martin, G. Spatial Patterns of Precipitation Change in CMIP5: Why the Rich Do Not Get Richer in the Tropics. Journal of Climate 26, 3803-3822, doi:10.1175/JCLI-D-12-00543.1 (2013).
Xie, S. et al. Global Warming Pattern Formation: Sea Surface Temperature and Rainfall. Journal of Climate 23, 966-986, doi:10.1175/2009JCLI3329.1 (2010)
Lead reviewer: Michelle L’Heureux