Data Snapshots Image Gallery
SST - Sea Surface Temperature
- Dataset Details
- Daily images, one per week, from 2000 to present
- Download Directories
- Click on any of the links below to view a directory listing of images and assets related to this dataset.
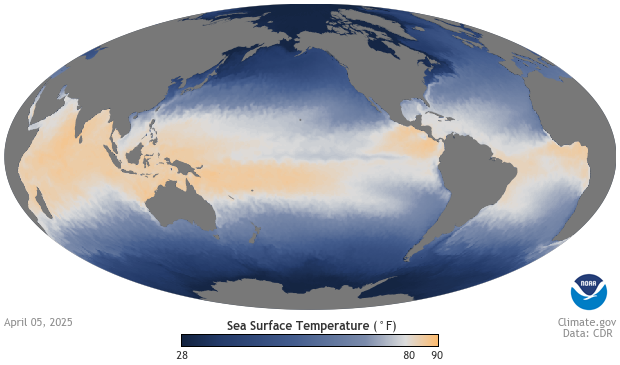
Colors on the map show the temperature of water right at the ocean’s surface. The darkest blue shows the coldest water: floating sea ice is usually present in these areas. Lighter shades of blue show temperatures of up to 80°F. White and orange areas show where surface temperatures are higher than 80°F, warm enough to fuel tropical cyclones or hurricanes.
Satellite instruments measure sea surface temperature—often abbreviated as SST—by checking how much energy comes off the ocean at different wavelengths. Computer programs merge sea surface temperatures from ships and buoys with the satellite data, and incorporate information from maps of sea ice. To produce the daily maps, programs invoke mathematical filters to combine and smooth data from all three sources.
The darkest blue areas show sea surface temperatures as low as 28°F. Sea ice, which can look like anything from a slushy mix of floating ice crystals to a solid surface of white, is usually present in these areas. Progressively lighter shades of blue show increasingly warmer temperatures, up to 80°F. White and orange areas on the map show where the surface temperature is above 80°F. Tropical storms that cross these areas can strengthen to form cyclones and hurricanes.
While heat energy is stored and mixed throughout the depth of the ocean, the temperature of water right at the sea's surface—where the ocean is in direct contact with the atmosphere—plays a significant role in weather and short-term climate. Where sea surface temperatures are high, relatively large amounts of heat energy and moisture enter the atmosphere, sometimes producing powerful, drenching storms downwind. Conversely, lower sea surface temperatures mean less evaporation. Global patterns of sea surface temperatures are an important factor for weather forecasts and climate outlooks.
Data Snapshots are derivatives of existing data products: to meet the needs of a broad audience, we present the source data in a simplified visual style. NOAA's Climate Data Records Program produces the Opitimum Interpolated Sea Surface Temperature files. To produce our images, we run a set of scripts that access the source files, re-project them into desired projections at various sizes, and output them with a custom color bar.
Various scientific groups have produced datasets showing Sea Surface Temperature. The images in Data Snapshots represent the AVHRR-only 1/4° daily OISST dataset. Data snapshots presents just one daily OISST image every seven days
References
Optimum Interpolation Sea Surface Temperature Technical Notes [pdf]
Richard W. Reynolds, Thomas M. Smith, Chunying Liu, Dudley B. Chelton, Kenneth S. Casey, and Michael G. Schlax, 2007: Daily High-Resolution-Blended Analyses for Sea Surface Temperature. J. Climate, 20, 5473–5496. doi: http://dx.doi.org/10.1175/2007JCLI1824.1
Improvements of the Daily Optimum Interpolation Sea Surface Temperature (DOISST) Version 2.1
About Optimum Interpolation Sea Surface Temperature (OISST) v2.1
- Data Provider
- NCEI Climate Data Records
- Source Data Product
- NCEI Optimum Interpolation Sea Surface Temperature (OISST)
- Access to Source Data
- HTTPS access to daily files (netCDF)
