This site offers maps showing average monthly wind speed and direction for the contiguous United States from 1979 to the present. Within the tool, click the Overview link in the upper right for information about the maps.
Maps show the average (mean) wind speed as well as two components of wind direction: U-wind represents the east-west component of wind and V-wind represents the north-south component. For each month and parameter, the tool shows the climatological mean wind (average over the previous three decades), observed winds, and wind anomaly (how much faster or slower wind blew compared to the long-term average for that month).
Where do these data come from?
The National Centers for Environmental Prediction (NCEP) and the National Center for Atmospheric Research (NCAR) used a computer model of Earth's atmosphere and a database of atmospheric pressure measurements from around the world to produce a picture of how Earth's atmosphere has moved since 1948. This dataset is called the NCEP/NCAR Reanalysis. Knowing the difference in atmospheric pressure from one location to another enabled scientists to program the model to compute wind speeds. Colors on these maps show estimated monthly average wind speeds calculated from the Reanalysis data.
-
How do I use the site?
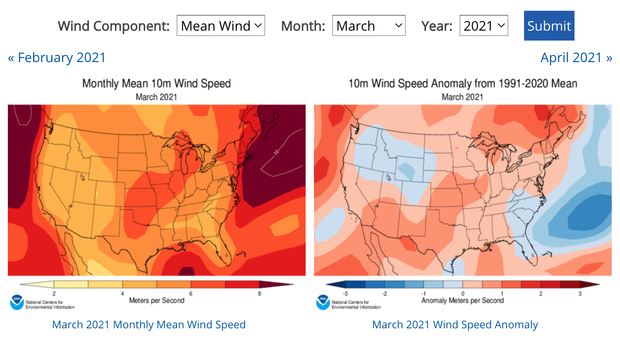
Go to the U.S. Wind Climatology site and use the pull down menus to select a year and month. Read the title of each map to understand what it shows. The "10m" part of the title indicates calculated wind speeds measured at a point 10 meters above the surface.
- The Monthly Mean Wind Speed map for each month shows the overall average wind speed at each location.
- The Wind Speed Anomaly maps show where average wind speed was slower (blue) or faster (red) than the recent 30-year average.
- The maps also indicate two components of wind direction: U-wind represents the east-west component of wind and V-wind represents the north-south component.
Links following Binary Wind Data are for downloading data as net-CDF files.
What can I do with these data?
You can compare maps of wind patterns across the contiguous United States for any month from 1979 to present. Information on wind speed and patterns is integral to the fields of renewable energy, climate change, and weather preparedness. By examining the maps, you can identify months of unusually high or low wind speeds, or check the U-wind and V-wind components to look for changes in wind direction.
 Click to see more detail
