Climatologists use historical and current climate and weather data make climate predictions for temperature and precipitation in the future. These outlook products are different from weather forecasts. Rather than predicting specific conditions on specific days, they indicate the chances that average weather conditions will be above- or below-average over the coming season.
Where do these data come from?
Climate scientists use a complex mix of weather models, historical data, current conditions in the ocean (locations of unusually warm and cool waters and currents), soil moisture content, experience, and expertise to predict which regions are likely to have above- or below-average conditions in the next 3 months.
Climatological data (1981 – 2010) provides “normal” ranges for temperature and precipitation: climate outlooks describe the chances that upcoming conditions will be in the top or bottom third of historical observations.
-
What can I do with these data?
Farmers, ranchers, firefighters, and water and natural resource managers commonly consult climate outlooks to anticipate and prepare for potential future conditions.
How do I use the site?
Click links in the selection table to view different maps and data:
- Under Outlook, select the time period of interest for maps showing chances for above- and below-average temperature and precipitation.
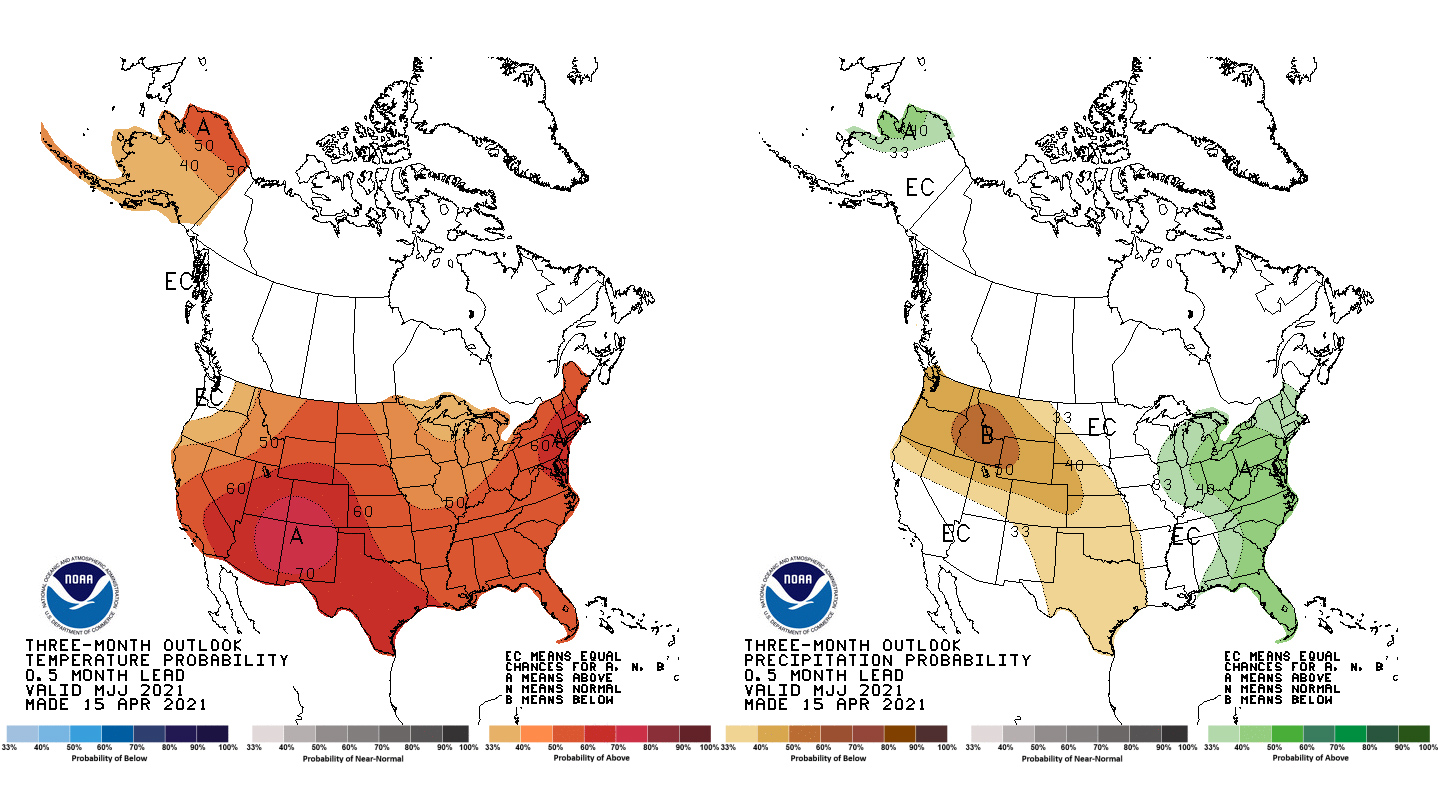
- NOTE: Shaded areas on these maps show where odds favor above- or below-average conditions. The darker the shading, the greater the chance for the indicated condition. White areas have equal chances for average conditions to be below, within, or above the long-term average for the month. Areas with darker shading DO NOT indicate predictions for more extreme conditions: rather they simply show where chances are higher for the indicated condition.
- Click N (Norm) for a table of Normal temperature and precipitation ranges for the next season at 102 different cities in the United States.
- Select T or P to see Probability of Exceedence (POE) maps for Temperature or Precipitation for the selected time period.
- Under Color Maps, select the desired title to view thumbnail views of various outlooks products, tiled so you can compare them.
- Under Outlook, select the time period of interest for maps showing chances for above- and below-average temperature and precipitation.
-
Data Format(s)KML, shapefile
Access Type Link & Description Visualization Choose a time period to view. -
Data TypeLand-based station, Marine / Ocean, Model, Severe weatherEssential Climate VariablesAir temperature, , , , , , , , , , , , ,Science OrganizationNOAA National Weather Service Climate Prediction CenterData StewardM.S. HalpertEmailMike.Halpert@noaa.gov
 Click to see more detail