Daily summaries answer questions such as
- What were the high and low temperatures at a station on a specific day?
- How much did it rain last Wednesday?
- How much snow was on the ground on a recent date?
Where do these data come from?
Daily weather records come from automated and human-facilitated observation stations in the Global Historical Climatology Network-Daily database. Data from each station are reviewed regularly for quality and consistency: the data have been checked for obvious inaccuracies, but they have not been adjusted to account for the influences of historical changes in instrumentation or observing practices.
What can I do with these data?
- Find daily records of high and low temperature and precipitation for most localities in the United States.
- Display different variables to look for patterns and compare them among different dates.
- Answer questions such as:
- Where did it rain or snow on a specific date?
- How does temperature change with latitude?
- How much snow was on the ground at a station on a specific date?
-
How do I use the site?
1) Start at https://www.ncei.noaa.gov/maps/daily-summaries/
2) In the first window, click Daily Summary Observations
3) Set the DATE and TYPE of data you want.
- In the Layers tab of the sidebar, use the pull-down menus to select your options:
- Set the calendar to the desired Date (data from today become available in two business days)
- Select the desired Observation (temperature, precipitation, snowfall, snow depth)
- Select the Units (Fahrenheit or Celsius)
- Select Options, if desired and available (not available for all data)
- Click Update Map
4) Choose WHERE you want it for.
-
Enter a placename or zip code in the SEARCH FOR A LOCATION field. This will zoom the map to your region of interest.
- DO NOT try to click the blinking red dot. It is NOT a station with data; it is only the center of the location your searched for.
- Click the wrench icon to access tools that will let you select your station(s) of interest.
- use the identity tool to select a single station at a time
- use the Rectangle tool to select a group of stations
- Stations you selected show up in the Results tab.
5) Preview and/or Download the data
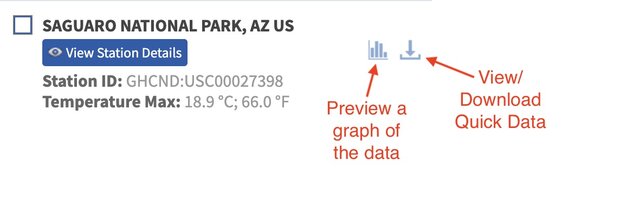
- Click the Graph icon to preview a graph of the data. (Note: Preview graphs show data in tenths of degrees Celsius.
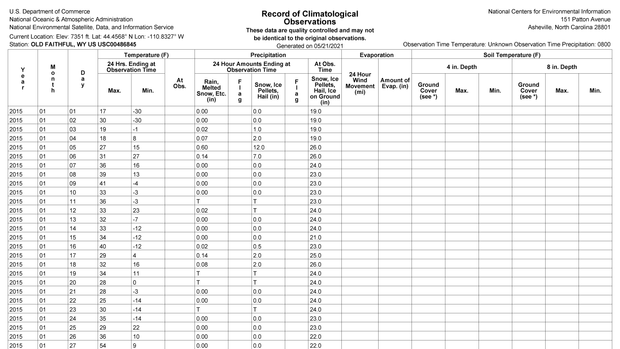
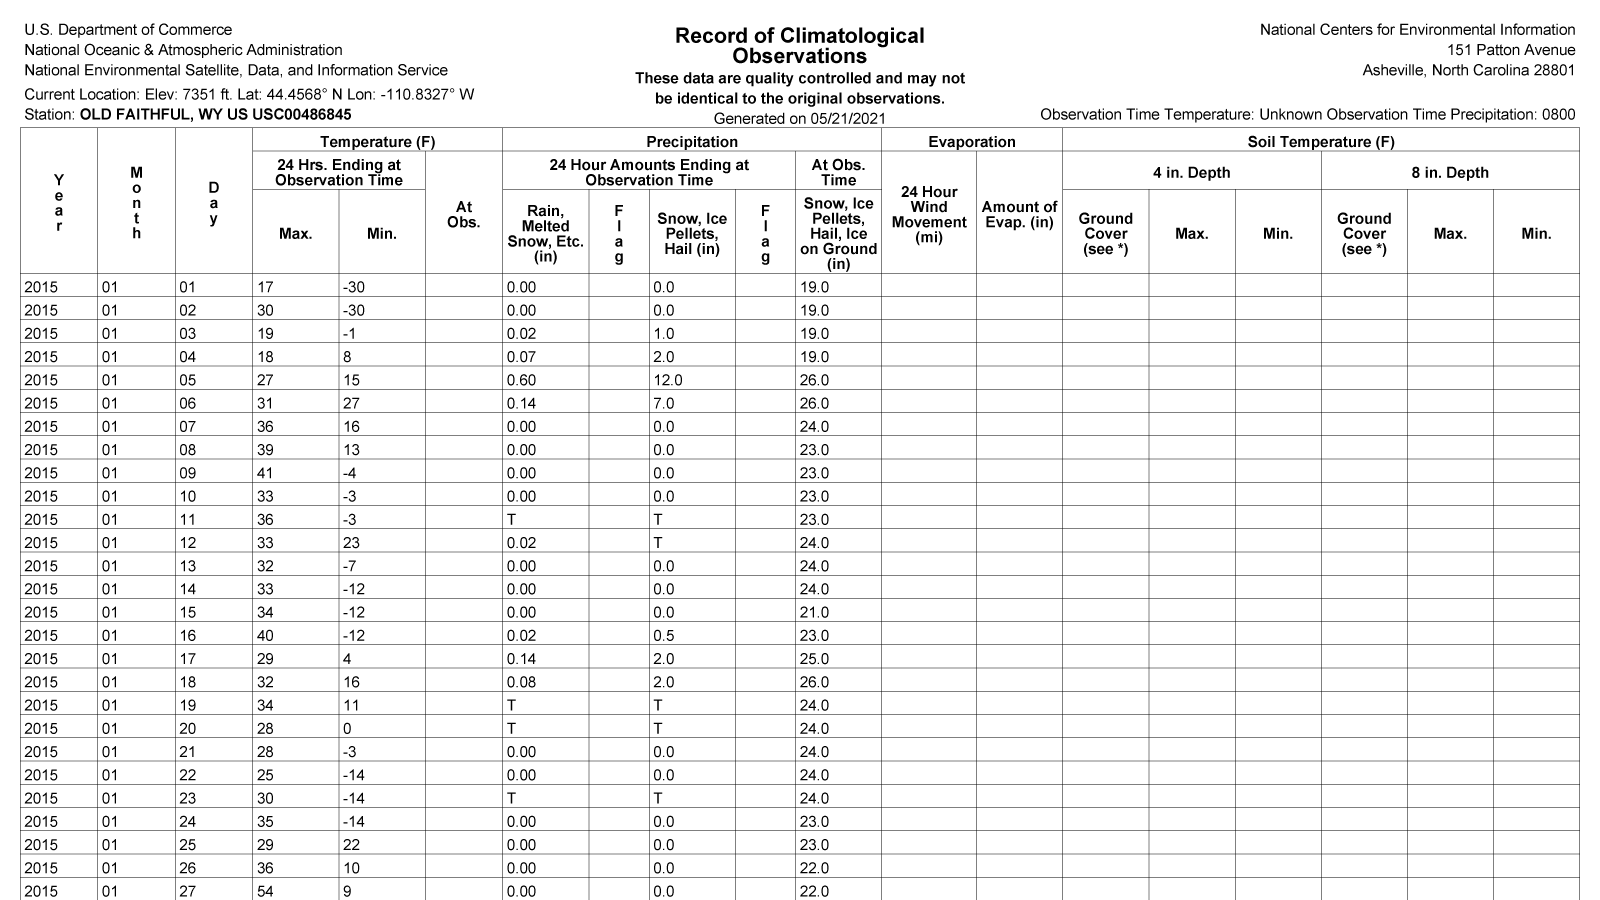
- Click the View/Download icon to download a PDF document of the data.
6) If you want to download a station's data in another format:
-
Check the box to the left of its name, and then click the Add to Cart button
- Complete the fields in the Cart window (non-certified data are free), then Continue
- Enter your email address.
- You'll receive a email confirming your order right away. Then, you'll receive another email with a link to download your data, usually within the hour.

 Click to see more detail
