Check past, present, and projected future climate conditions related to temperature or precipitation for any county in the United States. View graphs or maps to compare conditions observed in the recent past (1961-1990) with conditions projected in future decades.
Where do these data come from?
Data in Climate Explorer are from a worldwide climate modeling experiment called CMIP5 (Coupled Model Intercomparison Project Phase 5). In this experiment, climate modelers around the world programmed their models to simulate past temperature and precipitation (based upon observed atmospheric conditions) and to project changes in our atmosphere will affect future climate.
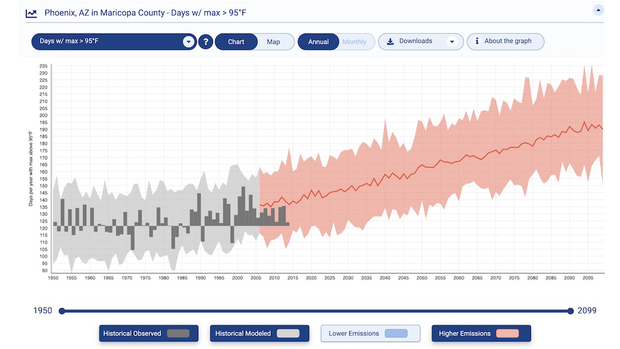
Future projections are based on two scenarios of how humans might change the atmosphere over this century. In one possible future, humans severely limit the amount of heat-trapping gas they put into the air. In another potential future, humans continue increasing the amount of heat-trapping emissions they release. The scenarios are called Representative Concentration Pathways or RCPs. The Climate Explorer shows projections for RCP4.5 as "lower emissions" and RCP8.5 as "higher emissions."
To make the projections useful at a county scale, coarse results (large pixels) from the global climate models were statistically downscaled using the Localized Constructed Analogs (LOCA) technique.
Learn more about the data in Climate Explorer on the site's About page.
What can I do with these data?
Explore variables such as the number of days when afternoon temperatures climb above 100°F in your county. Check how that number has changed from late last century to the present, and how it is projected to change in the coming decades.
If you're into winter sports like snow skiing or ice fishing, you might check how many days per year temperatures at your favorite winter recreation location remained below 32°F in the past, and then check how many similar days are projected to occur in the future.
Based on projected trends, you may recognize a need for preparation such as establishing cooling centers. You might also foresee new recreational or economic opportunities for the locations you explore.
-
Enter the name of a city or county in the search field on the Climate Explorer's home page.
Select one of the cards to explore past, present, or future projected climate in maps or graphs.
-
Data Format(s)CSV, PNG
Access Type Link & Description Graphing Explore how temperature, precipitation, and related climate variables are projected to change over the coming decades. -
Documentation Type Link & Description General General General -
Find Key Messages and other climate data from the Fourth National Climate Assessment describing current and projected future climate in each U.S. state.
-
Technical Notes
Climate.gov offers a range of Frequently Asked Questions regarding global warming.
Data TypeModelEssential Climate VariablesAir temperature,Science OrganizationNOAAEmailnoaa.toolkit@noaa.gov -
The Climate Explorer provides interactive graphs and maps showing past and projected climate conditions for counties and county-equivalents across the United States. Built to support the U.S. Climate Resilience Toolkit, the tool helps people explore projected future climate conditions that may put people, property, and other assets at risk.
FernLeaf Interactive and the National Environmental Modeling and Analysis Center (NEMAC) at the University of North Carolina - Asheville built the Climate Explorer’s graphing modules; they also built the interactive map modules which are powered by ArcGIS. All requests for historic and projected climate data are powered by ACIS web services. Habitat Seven led the initial design of the Climate Explorer interface. If you have questions or comments about the Climate Explorer, please direct them to noaa.toolkit@noaa.gov.
 Click to see more detail
