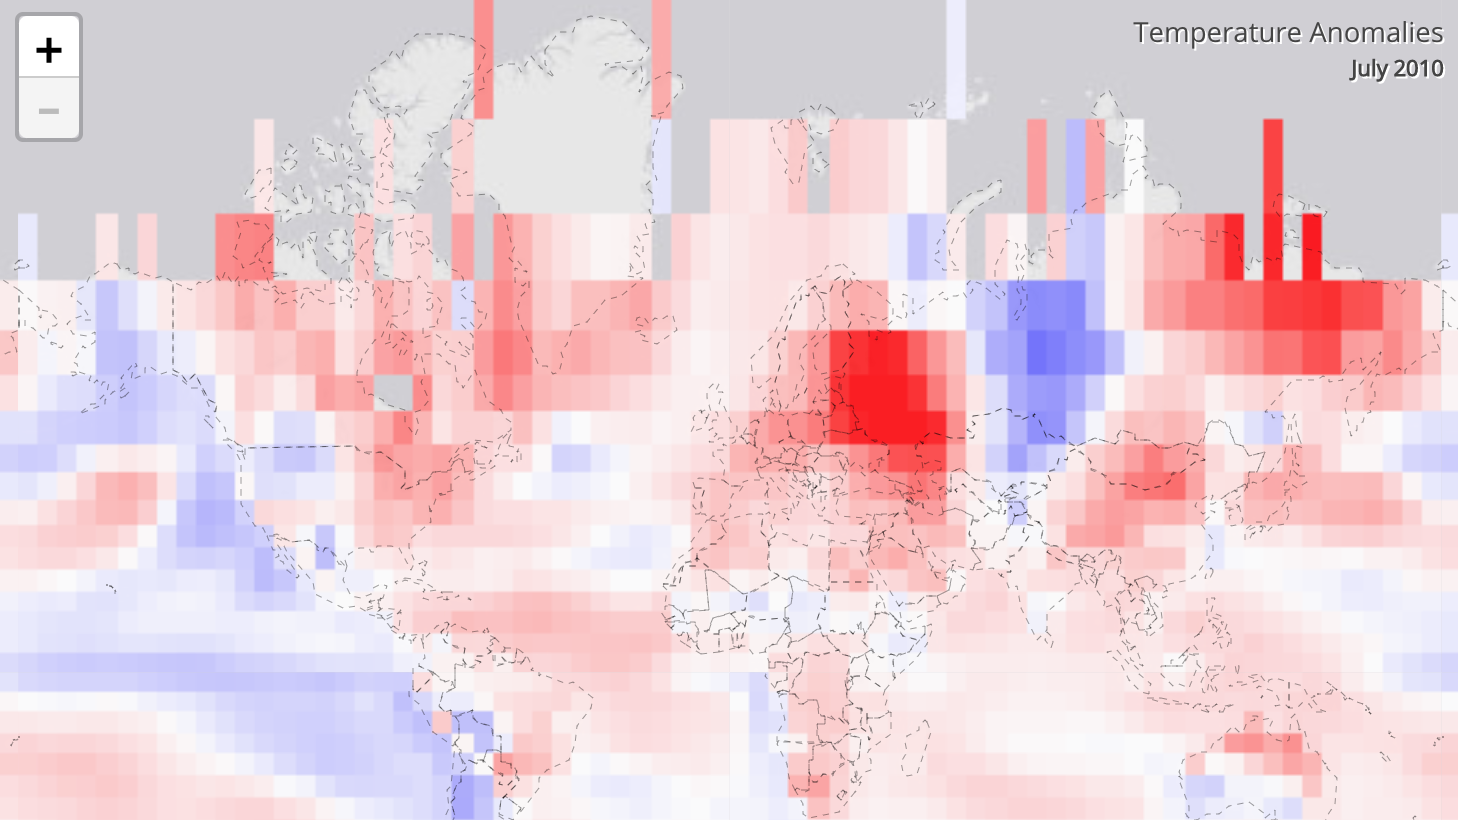
Interactive global land and ocean temperature anomalies maps, available at the NOAA Climate at a Glance website, provide valuable illustrative data. The anomalies are based on 1981-2010 mean.
Where do these data come from?
Global temperature anomaly data come from the Global Historical Climatology Network-Monthly (GHCN-M) data set and International Comprehensive Ocean-Atmosphere Data Set (ICOADS). A combined global land and ocean temperature anomaly dataset was created from these resources.
-
What can I do with these maps?
- Compare maps from January 1880 to present
- Zoom into specific grid point to get data on that location
How do I use the site?
Select Monthly or Annual and use the pull-down menus to select the desired timeframe.
Within the map, click on a 5° x 5° grid point to get more information about that location, including a Time Series.
-
Data Format(s)Other
Access Type Link & Description Mapping Generate and explore monthly or yearly maps from January 1880 to present. -
Data TypeLand-based station, Marine / OceanEssential Climate VariablesAir temperature,
Resolution
- Horizontal resolution(s)
-
- 500 km - < 1000 km
- 50 km - < 100 km
- Temporal resolution(s)
-
- Annual
- Monthly+
- Annual Climatology
- Monthly Climatology
Science OrganizationNOAA NCDCEmailncdc.orders@noaa.gov
 Click to see more detail