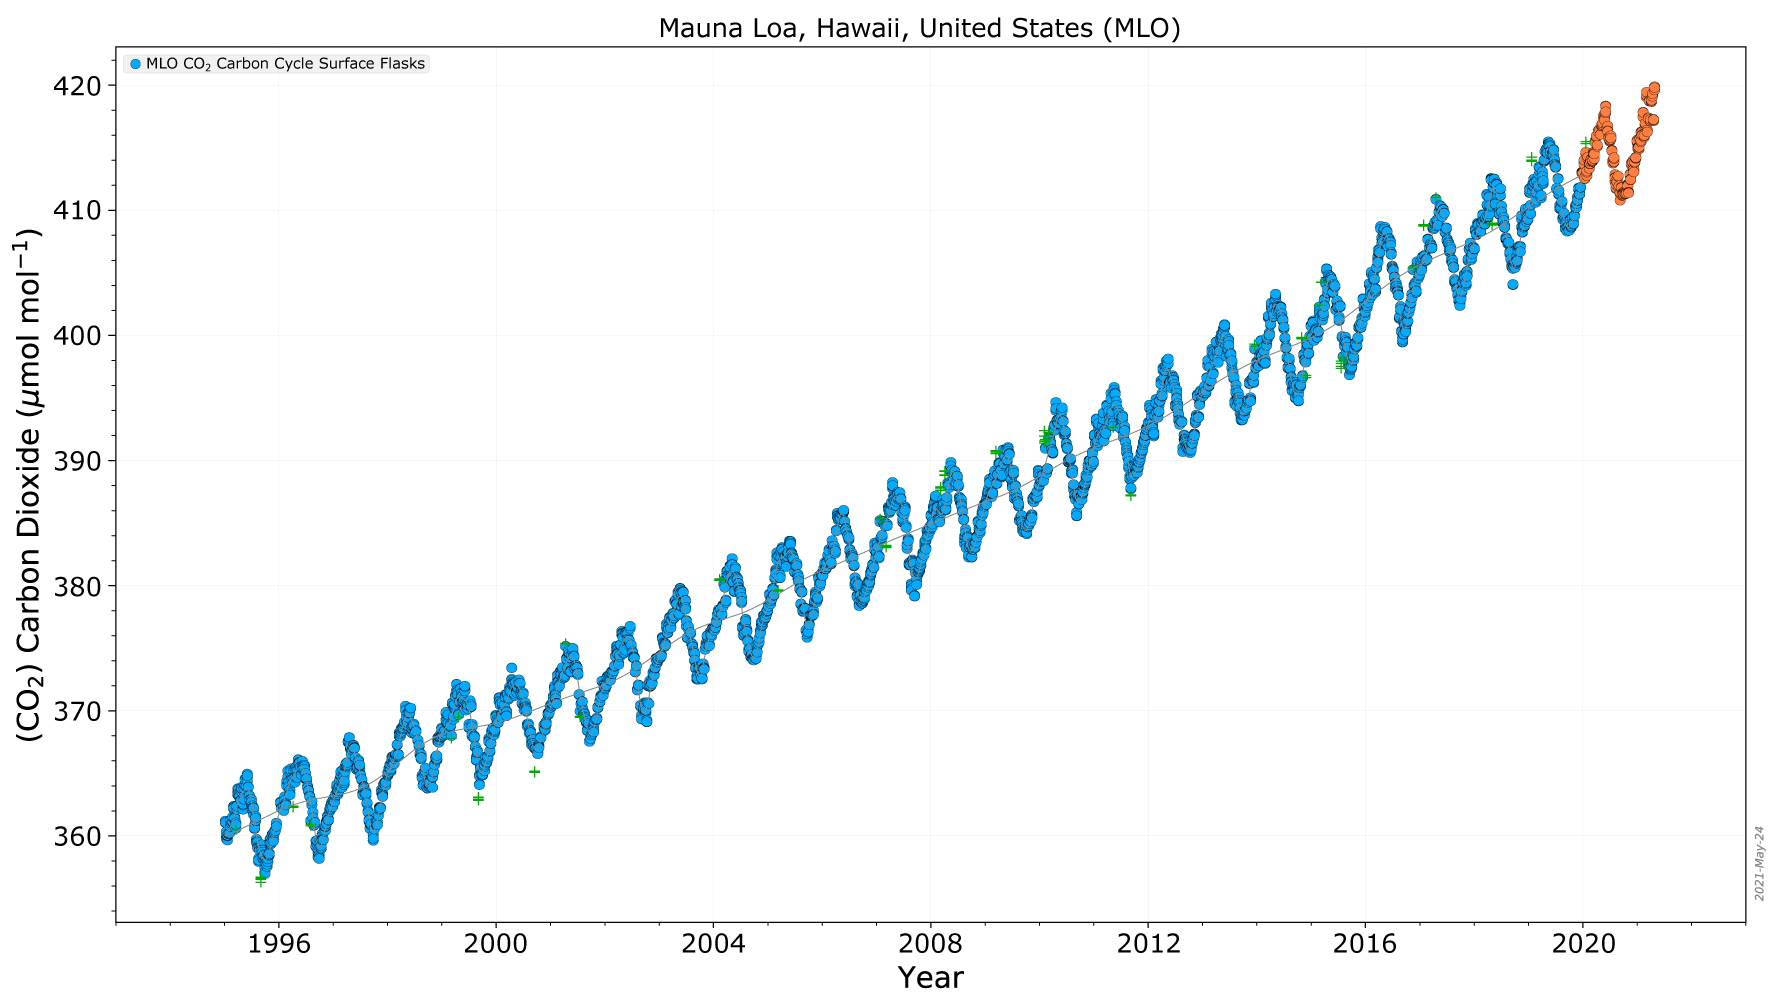
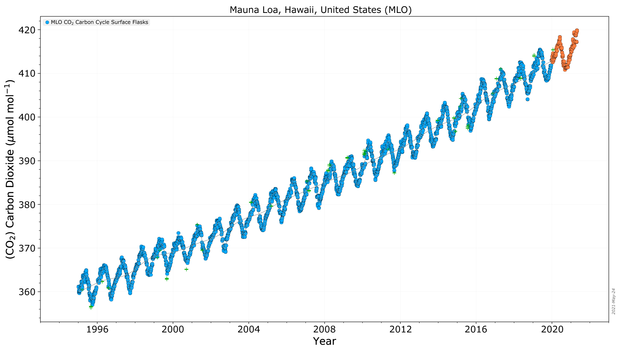
The Interactive Data Visualization tool gives users a way to explore the abundance of different gases at more than 200 sampling sites around the world. You can view graphs showing how the amount of carbon dioxide, methane, nitrous oxide, ozone, and various chlorofluorocarbons have changed over time at any NOAA sampling site. Additional data such as isotopic ratios of carbon and oxygen species and solar radiation are available for some stations.
Where do these data come from?
Instruments at air sampling stations around the world have been checking the amounts of different gases in Earth's atmosphere for decades. Many stations have instruments mounted at the top of tall towers to measure the abundance of gases in air in real time. In some locations, scientists or volunteers also collect air samples in flasks (glass bottles) and send the flasks to a central laboratory for analysis. The laboratory analyses are used to ensure the accuracy of the on-site instruments.
The Global Monitoring Laboratory (GML) at NOAA's Earth System Research Laboratory provides the data available through the Interactive Data Viewer tool. You can find descriptions and check the status of NOAA's four atmospheric observatories by clicking links under the observatory photos on the GML's Observatory Operations page.
-
What can I do with these data?
See how the abundance of gases such as carbon dioxide have changed over time
- Examine how the concentrations of greenhouse gases have changed over time
- Compare air samples from multiple sites
- Save graphs or download tabular data
How do I use the site?
- Click a symbol on the map to choose a Sampling Location
- Select a Measurement Program (for example, Carbon Cycle Gases)
- Select a Plot Type (for example, Time Series)
Once you select a plot type, you'll can make additional choices via dropdown menus. Make your choices and then click Submit. You can view the data directly on the site, download a PDF of the graphed data, or download the data for use in a spreadsheet program.
Use the dropdown menu choices to display graphs of other parameters or time spans.
-
Data Format(s)TXT (ASCII), PDF
Access Type Link & Description Graphing Access to data on the abundance of various gases in the atmosphere. -
Documentation Type Link & Description Interest Information about collection methods. -
Description, FAQ and data access for surface temperature anomalies.Data and information from the Global Greenhouse Gas Reference Network.
-
Data TypeLand-based station, Marine / OceanEssential Climate VariablesCarbon dioxide, , ,Science OrganizationNOAA Earth System Research Laboratory
 Click to see more detail