Generate maps showing data for each of the 344 climate divisions in the U.S. Climate Divisional Database. You can specify monthly or yearly values, ranks, or anomalies for temperature, precipitation, heating and cooling degree days, and drought indices.
Where do these data come from?
Measurements come from weather stations in the Global Historical Climatology Network-Daily (GHCN-D).
-
How do I use the site?
- Start at https://www.ncdc.noaa.gov/cag/divisional/mapping.
- Set drop-down menus to indicate your choices of State, Parameter, Year, Month, and Time Scale, and then click Plot.
What can I do with these data?
Choose various ways to display the map by clicking buttons just above it. Click...
- Values to see actual observed values averaged across the geography, parameter, and time indicated;
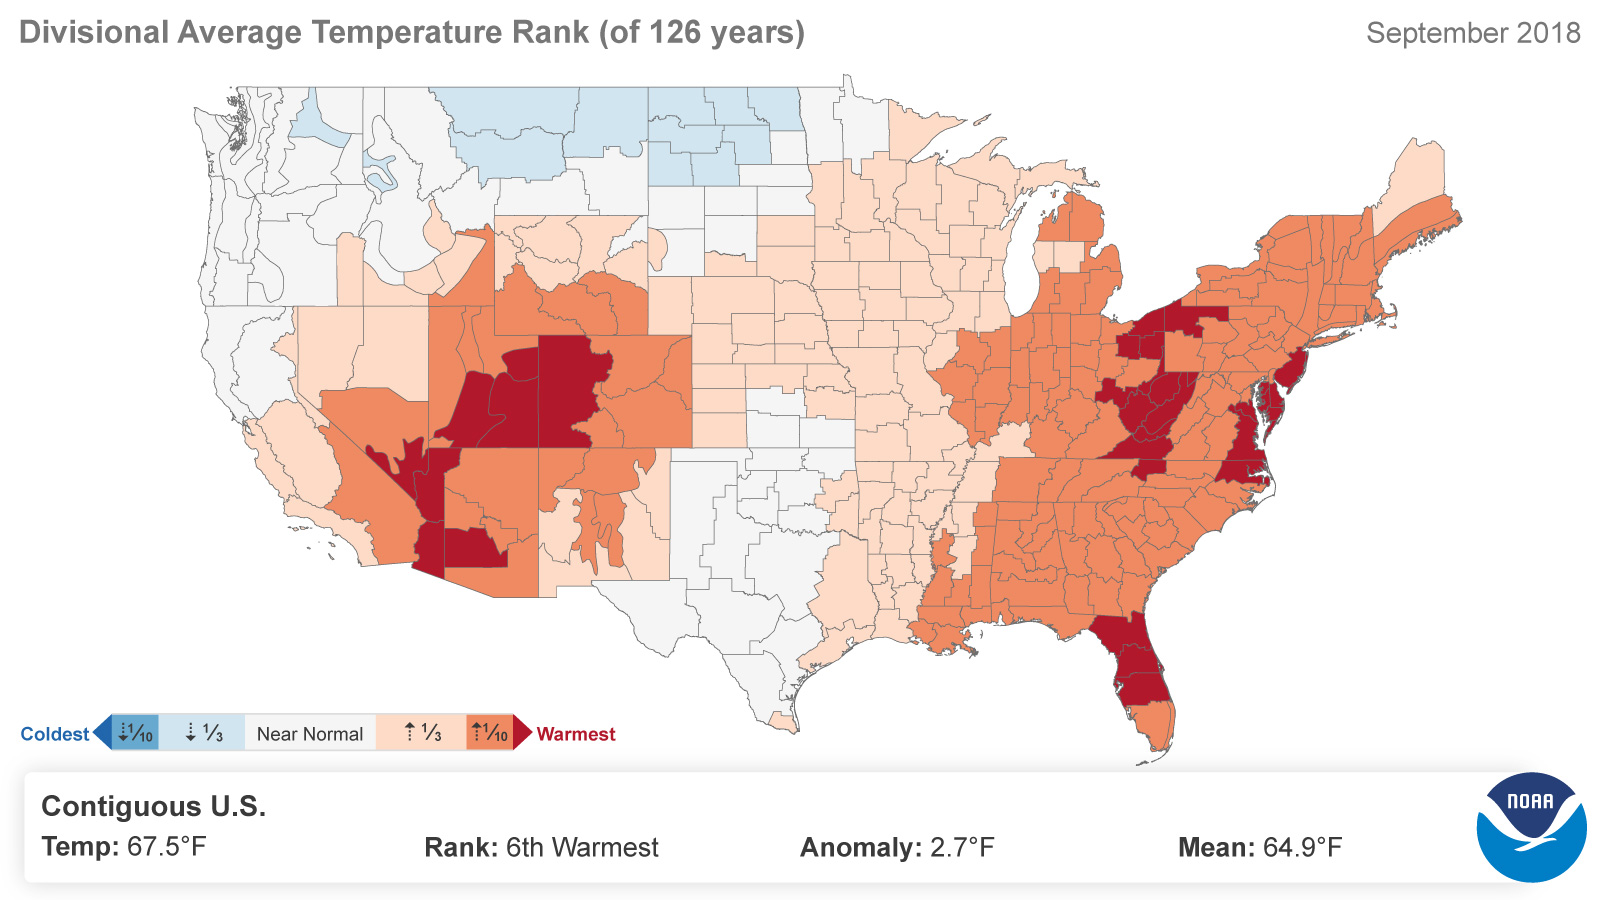
- Ranks to see how your period of interest compares to the historical record;
- 1901-2000 Mean to see the 20th century average for the month or season indicated; or
- Anomalies to see how the indicated period compared to the 20th century average for the same month or season.
 Click to see more detail